Unlocking the Power of DAX in Power BI for Data Modeling
Inspired by my recent research, past projects and acquired knowledge on the importance of understanding the relationship between a Power BI data model and Data Analysis Expression language, known as DAX – I decided to underscore this topic by sharing my experiences and findings with the community to hopefully inspire others to dive in and really take their data analysis skills to the next level by unlocking the true power of DAX in Power BI.
Data modeling in Power BI is a topic that has been brought more to the forefront for even the introductory level courses. Understanding data modeling is crucial for improving your reports and outputs and saving you hours of frustration looking for the root cause of an error that may just be due to a wrong relationship in your data model.
Today, many businesses or non-IT users of Power BI are bringing in their own data sources, such as an Excel file or a SQL Server database, connecting to Power BI Desktop not fully understanding what the Power BI engines are looking for in terms of a data model, then running into errors or performance issues when building visualizations and custom reports. Believe me, I have been there.
As more and more data comes in and the requirements for data literacy increase, understanding what Power BI looks for in the data model, from cardinality and relationships to filter flow and evaluation context, is critical. It also helps understand the efficiencies and performance tuning capabilities for optimizing DAX queries and custom measures. In this blog, I will briefly share my knowledge of these concepts in hopes of keeping the conversation going. So, let’s start by defining what a data model is in Power BI.
What Is a Data Model in Power BI?
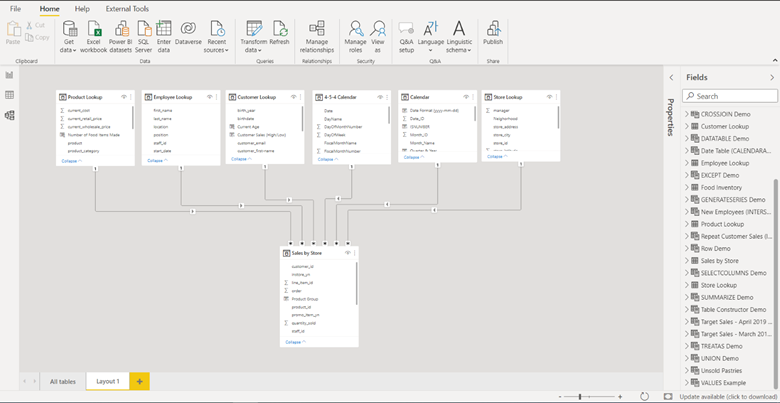
In general terms, a data model in Power BI logically represents the relationships between two or more disparate physical tables connected to each other using unique identifiers, also known as Primary Keys and Foreign Keys. These sensible relationship structures could be constructed; however the users may choose to design it, which is known as the schema. Typically, a best practice is to design your data model in a Star Schema made up of data (fact) and lookup (dimension) tables (see Figure 1).
Figure 1. Data Model example (Waterfall or Collie Method schema)
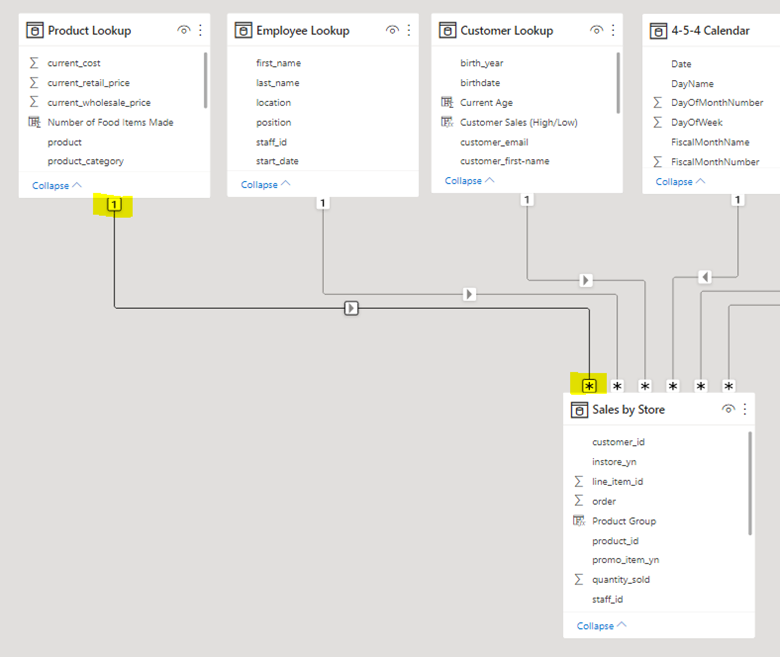
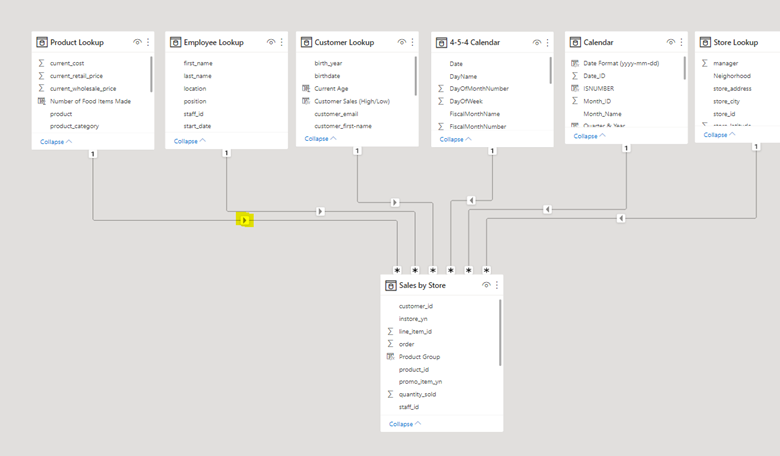
Cardinality, which represents the uniqueness of values in a column, defines each table and identifies the relationship between them. Relationships can be one-to-one, one-to-many, many-to-one, or many-to-many (see Figure 2).
Figure 2. Relationship from high cardinality (lookup table) to low cardinality (data table) example
Here’s a breakdown:
Data tables (or fact tables) are generally the tables that house the measurable values or metrics that the business is looking to analyze (ex. sales, transactions, quantity, events, pageviews, etc.).
Lookup tables (or dimension tables) are the descriptive attributes of the specific table. For example, a Customer table may have the first and last name, age, email, etc.
If you think about it this way, one customer from the Customer table may pop up many times in the Transactions if they are a repeat buyer, which means the Sales table has a low cardinality and the Customer table has high cardinality (see Figure 3).
Figure 3. Cardinality example
What Is DAX in Power BI?
DAX stands for Data Analysis Expression. It is the language designed by Microsoft to analyze data in many of their tools other than Power BI, such as PowerPivot and SSAS Tabular. DAX is the real analytical power that sits behind Power BI, and once you can master it, the analytical possibilities are endless.
Here are a couple of scenarios:
- DAX enables users to create custom measures to use as the values in a chart or visualization that can then be sliced and diced using fields from the lookup tables, such as total sales by state or by salesperson.
- DAX allows users to build virtual tables created from other related or non-related tables in the data model to use inside of other DAX functions.
The only way these DAX expressions would return the outputs you expect is if the data model has been created with an optimized schema structure that fits what Power BI is looking for.
Evaluation Context, What Is It, and Why Is It Important?
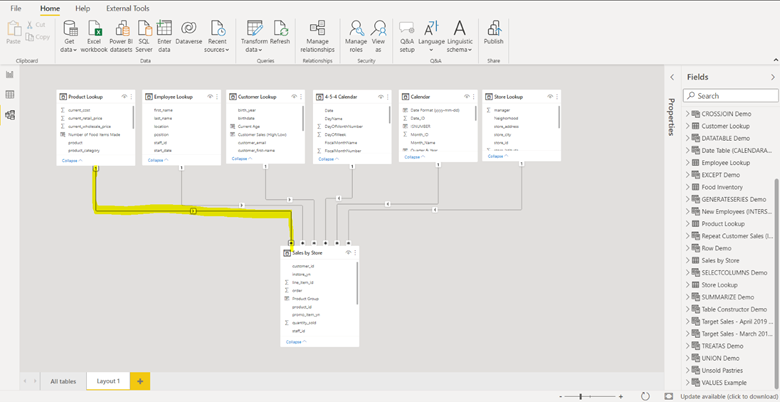
Evaluation Context is made up of filter and row context, which essentially tells DAX how to evaluate measures and calculated columns in the data model. Filter context does just what it says; it filters the tables in your data model from the one-side of the relationship to the many-side of the relationship and should be set as a unidirectional flow (only use bidirectional for particular situations and if you are indeed a master in Power BI). (See Figure 4).
Figure 4. Filter Context flow arrow from one-side of the relationship downstream to the many-side
Row context iterates through the rows in a table, and it does not propagate automatically through the tables unless you use DAX functions to enable it. Filter and Row context are simple to understand conceptually; however once you start writing more complex DAX, it is important to have a solid understanding.
Finally, to really demonstrate why both an optimized data model and evaluation context is so important to understand, I figured I would show one of the most common errors most beginners have experienced when first working with Power BI and DAX measure (see Figure 5).
Figure 5. Example of No Filter Context results in repeating value (also called Cartesian Product)
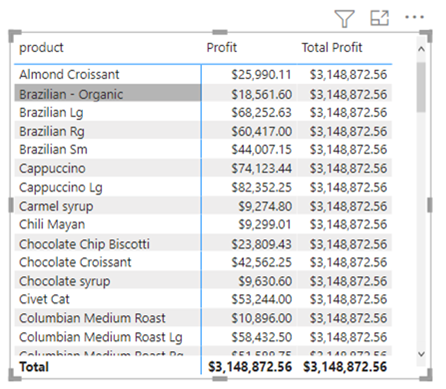
Notice how the Total Profit measure shows the same repeating value down the whole column. This is a prime example that there is no filter context being applied. Therefore, it is important to understand how an optimized data model is an absolute must to write efficient DAX queries and truly exploit the power of Power BI.
Bringing It All Together
To summarize, data modeling in Power BI is one of the most important foundations of your Power BI reports and dashboards. It is imperative to create a well-thought-out and developed data model to help communicate information effectively and efficiently for your organization. Coming from personal experience and from my research and community forums, understanding the concepts covered in the short blog will take your data analytics skills to another level, and have a lot of fun doing it.
Sneak Peak
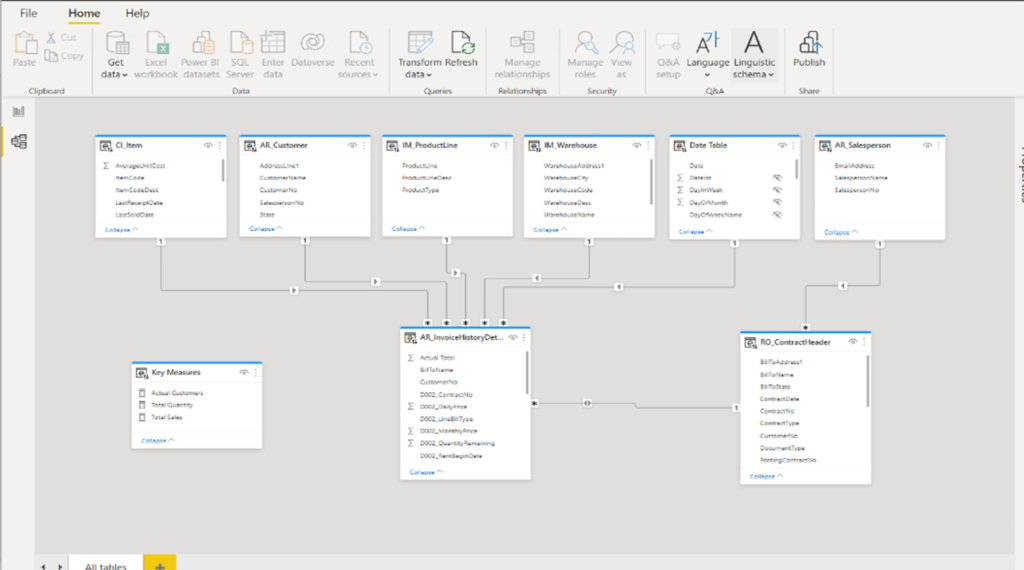
Are you the Power BI engineer/developer for your organization and constantly being asked to create reports using the same data model? Are you experiencing performance issues or lagging when loading visuals? Stay tuned for my next blog post where I will discuss the Power BI Dataset feature in Power BI Desktop. This commonly overlooked capability separates the data model from actual reports (think of the connecting reports as “thin clients” to the main data source). See Figures 6 & 7 below.
Figure 6. Power BI Data Set (notice side pane includes the model tab)
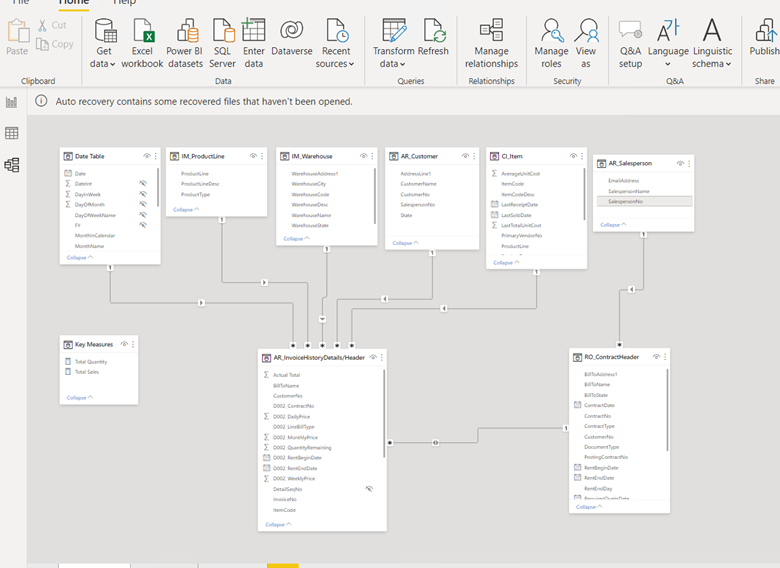
Figure 7. New Power BI file directly connected to the data model (notice blue bar on tables and no data tab)
Resources:
Perry, Adam. (2022) Advanced DAX for Microsoft Power BI. Referenced by https://www.udemy.com/course/advanced-dax-for-power-bi/learn/lecture/22358790#overview
Quintana, Manuel. Jul 21, 2021. Data Modeling (Star Schema) in Power BI – Creating Dimension Tables. Referenced by https://www.youtube.com/watch?v=7ciFtfi-kQs
Pearson, Mitchel. Oct 8, 2020. Beginning Power BI DAX Function Tutorial. Referenced by https://www.youtube.com/watch?v=QJw4HkagVWc