Agility Series: Agile Metrics
In the Previous Chapter
In the previous chapter, the focus was on choosing between Agile and Waterfall project management models and their applicability to different projects.
In This Chapter
It is said that “what gets measured, gets easily managed, improved and gets done too.” Any project is a series of activities and interim outputs. These interim results help gauge the project’s health and indicate a team’s performance against quality and milestones.
Agile methodology defines certain metrics that help in tracking, such as project progression across different areas like project development, quality, project management and customer satisfaction.
Let’s focus on some of these important agile metrics.
The Burndown Chart
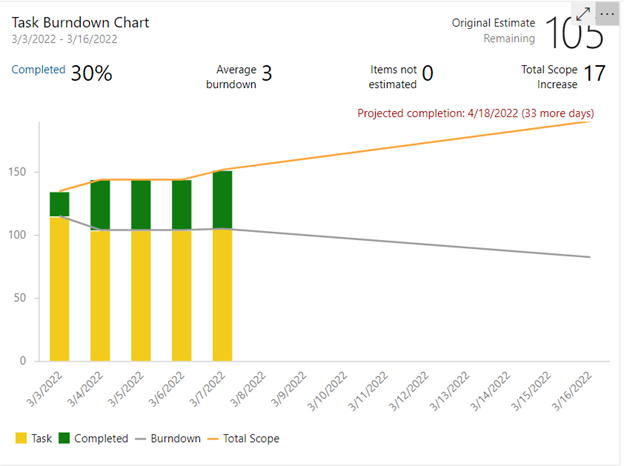
A burndown chart tracks both the work completed and the remaining work throughout the development sprint. The chart gives a real-time prediction of the development goals and gives a pictorial representation of planned work v. actual work. Similar burndown charts can be drawn for tasks, bugs and user stories.
By using a burndown chart during a development sprint, a team can predict a schedule slippage well ahead, balance the work among the team and realize when to take the required steps to catch up if they have fallen behind.
The image below is an example of a task burndown. The image depicts the projection of the tasks against the actual progress, percentage of tasks completed and variations in scope. The chart’s x-axis represents time, and the y-axis represents the amount of work left to complete (in story points or hours).
Velocity Chart
The velocity metric chart calculates the average amount of work (measured in hours or story points) a Scrum team completes during a development sprint. This metric gives an idea of work that can be completed in a timeboxed sprint and hence helps in forecasting and planning. Upon certain iterations, product owners can get the accurate velocity of the team.
Velocity is calculated by averaging the committed work, and actual completed (achieved) work for a few initial sprints.
From the example velocity chart mentioned below, it can be derived that team’s velocity is reasonably around 32 story points.
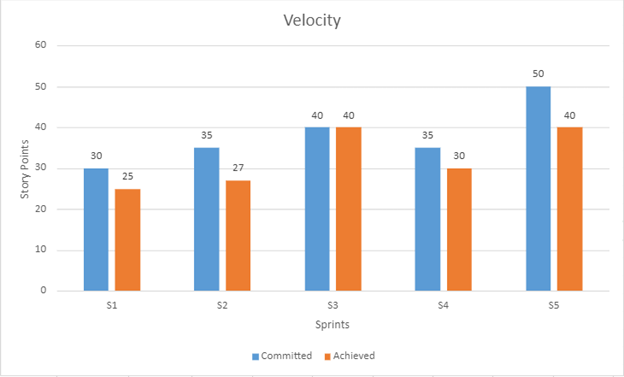
Then, this velocity chart can be used for planning. For example, there are items amounting to 640 story points in the backlog. If the team’s velocity is 32 story points, a product owner can estimate that the team will need at least 20 sprints to complete the items in the backlog.
A team’s velocity is dynamic and unique. It needs to be monitored regularly and considered for estimation accordingly.
A team’s velocity can increase over time with improvements in the process, product expertise, the introduction of tools/technologies that ease the mundane work and other optimization initiatives. A team’s velocity can also go down when there are new members in the team, inefficient processes, poor adaption to change or ignoring the gaps.
Defects
Once the product development kicks off, defects start creeping into the system, and they can take a major share in the product development cycle along with product backlog.
It is important to consider the flow of these defects so that they can be arrested early in the life cycle and implement a left-shift quality protocol.
Different traditional metrics are calculated against defects (as applicable) to understand their origin and disposal:
- Defects found by development team
- Defects found by the quality assurance team
- Defects found by external teams
- Defects found by automated tests
- Defects reported post-release
- Defects that required hotfixes/patches
- Defects that caused code change
- Defects that are resolved as invalid defects
- Defects caused due to wrong setup/test environment
- Defects caused due to incorrect product/design documentation
- Defects deferred to future releases
- Customer support issues turning into defects
Once defects are categorized and related metrics are ready, brainstorming/retrospective sessions can begin to understand the escape, identify and address the inefficiencies and then compare the metrics again post-corrective methodologies to look for change.
Deployments
In the Continuous Integration and Continuous Deployment approach, builds are deployed in different hierarchical environments (development, test and stage), with production being the ultimate goal.
Failed or unsuccessful deployments are the number of deployments that failed to take place over a given period of time in a certain environment. If the deployments fail in pre-production environments, they slow down the qualification cycles and hamper the release of the product to the production/market.
Depending on the cadence of the product’s release, the deployment success rate is calculated continuously to identify the trend and act accordingly.
For example, from the deployment chart below, it can be inferred that the deployment rate is only 80% on Fridays compared to 100% on other days of the week (W). The lower deployment rate could be due to large code merge on Fridays, sprint closure rush and/or other similar activities.
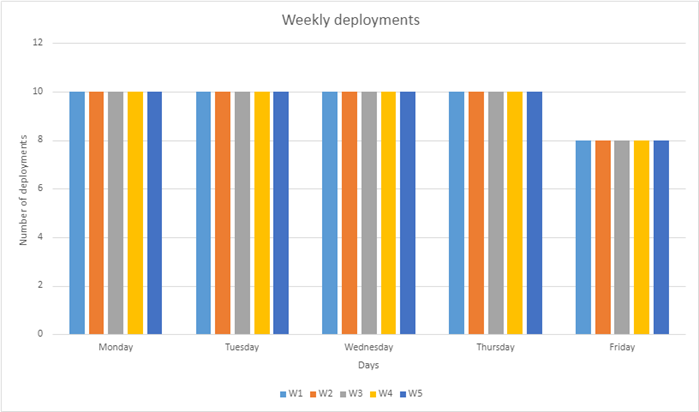
The goal is to achieve zero deployment failures on any given day to ensure that the agile team is building a working software.
Subjective Metrics
Subjective metrics are collected to understand the satisfaction level of agile team members and customers.
Employee Satisfaction
This metric is basically to find the answers to:
- Are the people in the team satisfied?
- Are they continuously learning?
- Does the team feel free to innovate?
- Are the processes helping or unnecessary overhead?
- Are the agile tools helpful?
Customer Satisfaction
Ultimately, it is the customer who must be happy first. This metric is basically to find the answers for:
- Is the team meeting the customer’s needs?
- Is the team delivering on time?
- Does the team deliver a product free of bugs and other issues?
- Is the product documentation good enough to understand and use the product?
- How is customer support?
Conclusion
Metrics are supposed to provide the quantitative insight into productivity through the different phases and areas of the software development lifecycle.
The metrics should be easy to generate and should not be a burden on the team. They should be constructive parameters to predict the progress of the release.
Metrics, along with retrospective feedback, can change how products are delivered by maintaining quality and the value of the brand.