



Articles

Managing AI-Triggered Fund Valuation Risks through Dynamic Portfolio Monitoring

Key Takeaways

AI is reshaping software business models faster than quarterly private marks can adjust, and the gap between public market signals and reported NAV has become a governance consideration across private credit, private equity and venture capital portfolios.

Operational improvement alone may not offset a structurally lower exit multiple, making it important to model AI initiatives through the financial statements and track them against leading indicators such as NRR, CAC and churn.

Forward-looking portfolio monitoring, built on leading indicators, AI disruption scoring and macro stress testing, can help fund managers keep both the investment thesis and the ASC 820 mark defensible to LPs, auditors and buyers.

Overview

The private credit redemption wave of early 2026 highlighted a limitation many alternative asset managers had already recognized: quarterly marks and GAAP financials alone may not give limited partners (LPs) sufficient confidence in reported values. Fund managers that build forward-looking portfolio monitoring infrastructure before the next stress cycle may be better positioned to navigate it.

In early 2026, several of the largest private credit funds received redemption requests representing 8% to 12% of their net asset value (NAV) in a single quarter, volumes that stressed or exceeded their 5% quarterly redemption limits. The trigger was a repricing in public software markets driven by concerns about AI competition and displacement. Software equities fell by more than 20%, shedding over $1 trillion in value, yet private credit portfolios exposed to roughly $500 billion in SaaS lending reported largely unchanged NAVs. Those marks are set quarterly by managers, validated by firms they retain, and produced on a reporting cycle that cannot respond to daily market signals. Meanwhile, the secondary market was pricing publicly traded vehicles at discounts of 15% to 32% to stated NAV. Investors noticed the gap and submitted redemption requests.

In many respects, this was a governance issue rather than a credit event. The concern was not that assets were known to be impaired, but that investors had no independent mechanism to assess whether they were. When confidence in reported values erodes, exiting can become the rational response, as it is in public markets. The same structural vulnerability exists in PE funds, VC portfolios and growth equity vehicles with software holdings. Private credit was the first to feel the pressure; other parts of the alternative asset class may follow on their own timelines.

Enhanced disclosure alone may not close this gap. Systematic, forward-looking portfolio monitoring across private equity, private credit and venture capital holdings that operates independently of the quarterly reporting cycle can help.

For more on how AI is changing software business models and valuation assumptions, read How AI Is Resetting the SaaS Valuation Multiples in Private Equity and Private Credit.

The Bifurcation of Software Values

How Is AI Disruption Affecting Private Portfolio Values?

Although the redemption pressure surfaced in private credit, the AI disruption compressing software valuations is not confined to it. Software represented 18% of PE deal value in 2025, and SaaS accounted for nearly 33% of all venture funding. The multiple compression affecting software debt may also be compressing the equity value of PE and VC holdings in comparable assets, often without immediate visibility, because quarterly marks tend not to move until they must.

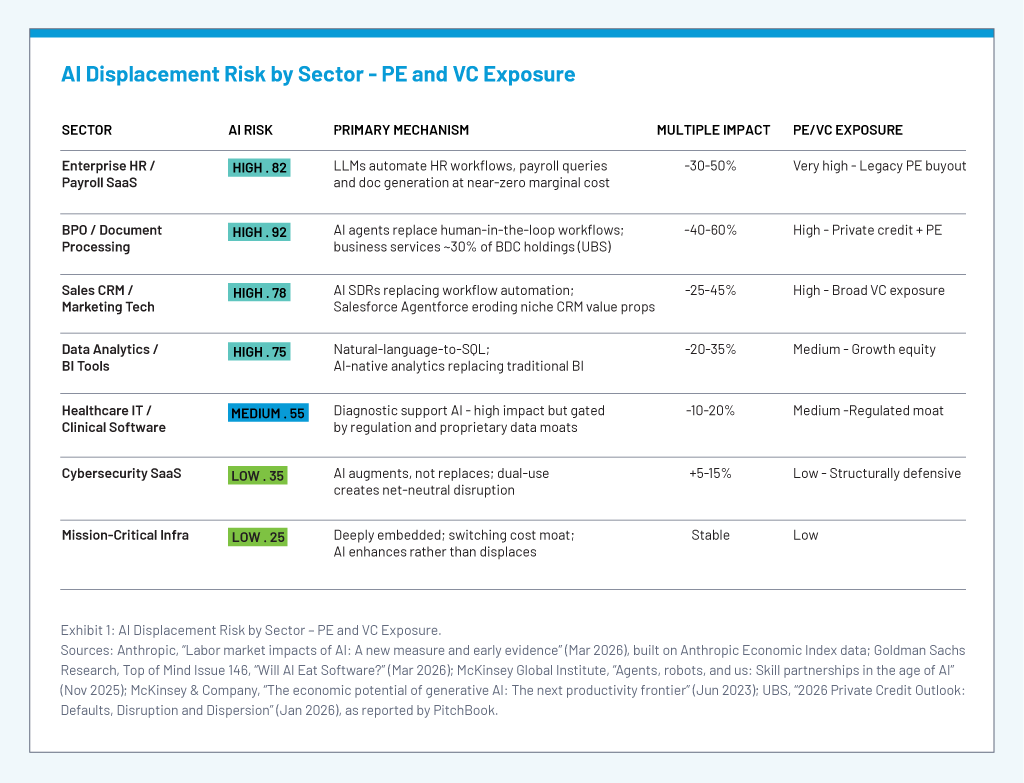
Public investors are increasingly pricing software companies on a single criterion: AI application opportunities versus AI displacement risk. Seat-based SaaS, including HR workflow automation, BPO and sales CRM, may face structural demand erosion as AI agents replace the employees who generated the seats. A customer that deploys one large language model (LLM) agent in place of three software seats is unlikely to renew all three. That compression can remain invisible in GAAP revenue for two to four quarters. It may be visible earlier in net revenue retention (NRR), customer acquisition cost (CAC) trends and the AI in-house replacement percentage tracked at the holding level, where those metrics are monitored.

Many general partners (GPs) may not yet know which side of this divide their holdings fall on. Exhibit 1 maps exposure to AI displacement by sector. Fund managers that have mapped this exposure, and built the monitoring infrastructure to track how it changes, may be better positioned for the next stress cycle.

The Role of Portfolio Monitoring in Private Equity

What Is Portfolio Monitoring and What Does It Do?

Portfolio monitoring is the continuous, systematic tracking of each holding’s operational, financial and competitive health across the full investment lifecycle. When performed well, it converts quarterly reporting data into investment decisions, governance documentation and LP communication before deterioration becomes difficult to reverse. It is not a backward-looking compliance function but a forward-looking risk management discipline: GAAP financials confirm what has already happened, while effective monitoring can surface what may happen next. Its value differs by stakeholder:

The Limits of Traditional Tools

Why May Traditional Reporting and Monitoring Tools Fall Short?

Many reporting and portfolio monitoring platforms track GAAP metrics and produce dashboards that confirm what management accounts already show: revenue up, EBITDA within plan and covenants unbreached. Yet the investment may still be deteriorating. A SaaS company whose NRR has declined from 112% to 101% may continue to report steady revenue growth for two to four quarters before the trend reaches the income statement. By then, the comparable public multiple may already have compressed while the private mark has not moved.

A more forward-looking framework layers three dimensions on top of GAAP reporting:

  1. Sector-specific non-GAAP leading indicators that reveal unit economics before they reach the P&L
  2. AI disruption scoring that quantifies competitive exposure at the sector and holding level
  3. Macro stress testing that models the compounding effect of rate paths, recession probability and cost inflation on fair value

The Operator’s View

What Does AI Repricing Mean for Operating Partners?

The sections above address AI repricing from the valuation perspective: how marks are set, verified and defended. Operating partners see the same issue from inside the portfolio company. They cannot set the multiple a buyer will pay at exit, but they can influence the earnings to which that multiple is applied by introducing AI tooling, redesigning processes and expanding margins. Three practices can help operating partners respond.

1. Test Whether Operational Improvement Can Offset Multiple Compression

Operating partners can meaningfully improve EBITDA. The question is whether that improvement is enough to offset the value lost to multiple compression at exit. Because exit value is the product of EBITDA and the exit multiple, a 20% EBITDA improvement combined with a 30% multiple compression produces an exit enterprise value of 0.84 times entry value (1.20 × 0.70), even though the operating plan was delivered. If half of the purchase price was debt-financed, equity value would decline by 32% before any deleveraging. This can be a difficult conversation for operating partners, and one that may be more productive early in the hold period than at exit.

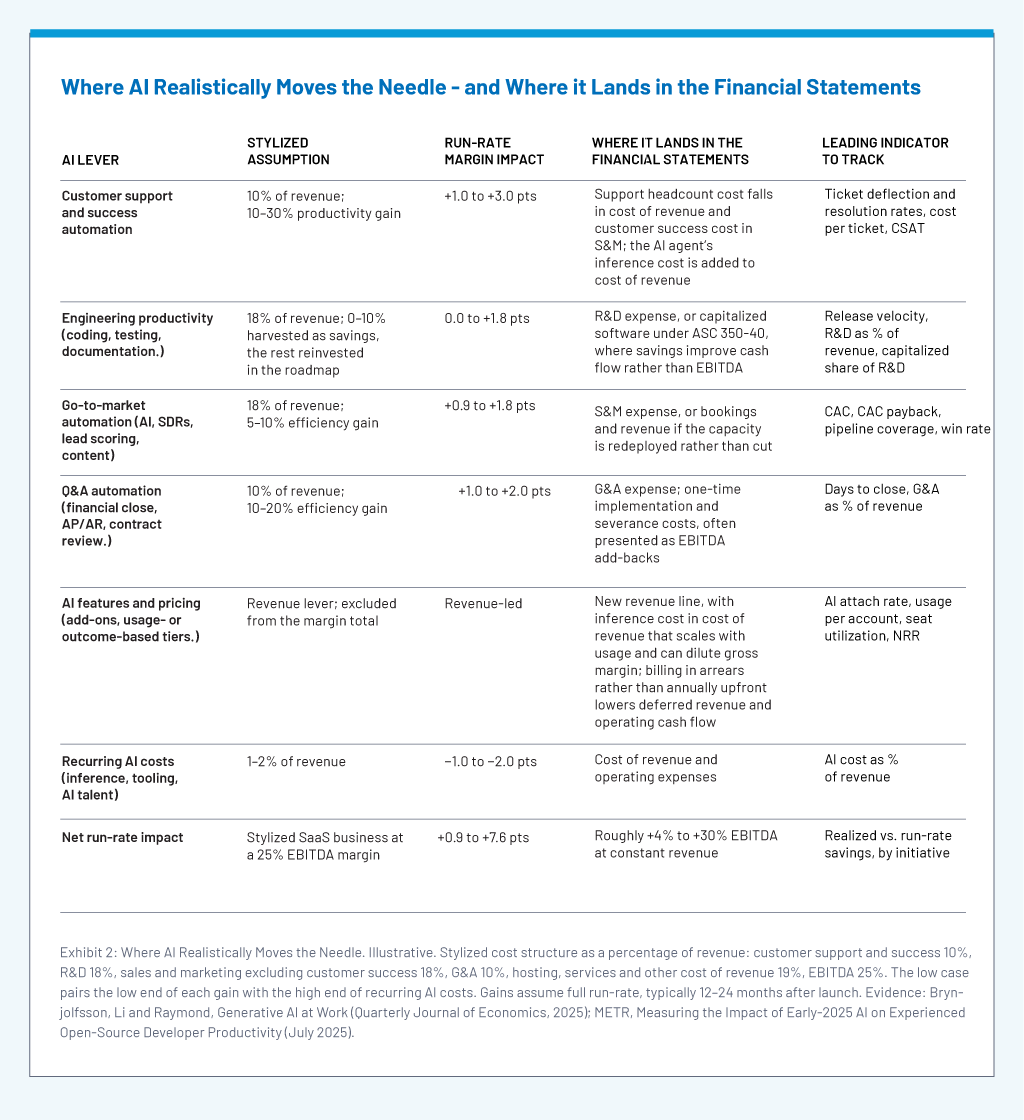
AI’s realistic contribution is likely to come first on the cost side and may be smaller than many value creation narratives assume. For a stylized SaaS business at a 25% EBITDA margin, a well-executed program across customer support, engineering, go-to-market and G&A might add roughly 1 to 7.5 points of margin at full run-rate, net of inference, tooling and AI talent costs, or approximately 4% to 30% more EBITDA at constant revenue (Exhibit 2). The evidence remains mixed: a study of more than 5,000 customer support agents found a 14% productivity gain from an AI assistant, while a 2025 randomized trial found that experienced open-source developers took 19% longer on tasks when allowed to use AI tools.

Returning to the illustration, offsetting a 30% compression at flat revenue would require lifting a 25% EBITDA margin to nearly 36%, beyond the top of the range in Exhibit 2. If the 20% EBITDA growth comes from revenue growth at a constant margin, AI would still need to add almost 5 margin points just to recover the entry value. Where compression reaches 40% or more, even the top of the range may fall short. In practice, the achievable range may narrow further. Savings typically take 12 to 24 months to ramp. Competitors with access to the same tools may compete part of the gain away through pricing. In seat-based models, the technology that lowers a company’s costs can also lower its customers’ headcount and, with it, the seats on which revenue is built.

This points to a larger lever: the multiple itself. In the illustration, each percentage point of compression avoided is worth about 1.7 times a percentage point of additional EBITDA growth. Moving a business toward the AI application side of the divide, by embedding AI in the product, shifting from seat-based to usage- or outcome-based pricing and building on proprietary workflow data, may help limit compression. Buyers are likely to look for evidence of that shift in leading indicators rather than in trailing EBITDA.

2. Track Leading Indicators, Not Just Lagging Ones

Operators tend to manage businesses through leading indicators such as CAC, NRR, churn, pipeline coverage, seat utilization and product usage, which show where the business is heading. Lagging indicators such as revenue, EBITDA and covenant headroom confirm where it has been. In subscription businesses, the lag is structural: revenue is recognized ratably, so a customer that decides today to reduce seats at renewal affects GAAP revenue only after the renewal date, and then gradually. By the time lagging metrics reflect the problem, much of the value may already be lost, because a buyer, or a market participant valuing the business today, prices the leading indicators rather than the trailing P&L.

Managing AI - Leading Indicators -FVS

Each step along this chain adds lag and narrows the options available. Operating responses such as repricing, repackaging or a product change typically take several quarters to show results, and a signal that first appears in the P&L in year three or four of a five-year hold may leave too little time for a remedy to register before exit.

AI Can Help in Two Ways

  1. It can improve the indicators themselves. Churn-prediction models that combine product telemetry, support history and billing behavior can help customer success teams intervene before a renewal is lost; AI-assisted onboarding can shorten time-to-value, when early churn is often decided; and improved lead scoring can concentrate acquisition spend and lower CAC.
  2. AI can flag deterioration earlier than periodic human review. Much of the earliest evidence of AI displacement sits in unstructured data such as support tickets, call transcripts and renewal correspondence, where customers ask about reducing seats or building capabilities in-house. Language models can review that material across the full customer base on a continuous basis and convert it into structured signals, such as the AI in-house replacement percentage discussed earlier, while anomaly detection can flag cohort-level shifts in NRR and seat utilization as they occur.

This connects directly to portfolio monitoring. The indicators an operating partner uses to run the business are the same sector-specific non-GAAP indicators a GP needs to support a mark and an LP needs to evaluate it. To be useful, KPI definitions should be consistent across holdings (NRR alone is calculated in several different ways), and data should come from systems of record rather than management presentations. Neither requirement is an AI problem, but both are prerequisites for AI to add value.

3. Model AI Initiatives Through the Financial Statements

Many AI value creation plans begin as a narrative: deploy a support agent, reduce ticket costs by a third, redeploy engineers to the product roadmap. The direction is often right, but the magnitude, timing and location of the impact are frequently less clear, and buyers, lenders and auditors tend to discount what they cannot trace. A driver-based, integrated three-statement model in which each AI initiative carries explicit assumptions (volume driver, adoption curve, unit cost and one-time cost) linked to the line items it affects can address that gap. Exhibit 2 provides a starting framework. A model built this way can help answer questions a narrative cannot:

The model also connects the three practices. It is where the arithmetic of multiple compression becomes company-specific (how much EBITDA the AI program must deliver, and by when, given the multiple a buyer is likely to pay), and it can assign each initiative a leading indicator and a target path for portfolio monitoring to track every quarter. For GPs, the model can also support the mark. When a fair value measurement under ASC 820 relies on projected AI-driven margin expansion, those projections should reflect market participant assumptions, and auditors may ask how each one ties to evidence. A traceable model provides that evidence; an unsupported margin bridge may present valuation risk.

Portfolio Monitoring as a Continuous Risk Management Discipline

The private credit redemption wave may prove to have been less the event than the signal. The conditions that produced it – quarterly marks, manager-retained validators and no real-time price discovery – are present across illiquid asset classes, and PE portfolio companies and VC-backed SaaS businesses may be at an earlier stage of the same journey. For operating partners, a structurally lower exit multiple means value creation plans may need to be larger, earlier and better evidenced than before.

The tools exist and the regulatory expectations are documented. Fund managers that treat portfolio monitoring as a continuous risk management discipline, rather than a quarterly reporting exercise, may be better positioned to demonstrate, holding by holding, why both the investment thesis and the mark remain defensible. The question is whether that infrastructure is built before the next stress event or during it. The public and secondary markets will not wait for the next reporting cycle to form a view.

Withum plus signs.

Have Questions or Need Guidance?

If your fund is reassessing software holdings or the assumptions supporting reported values, contact Withum to discuss portfolio valuation and monitoring needs.

Contact Us

Related Insights

Read more
glowing car with a question mark above
Dealership Valuation FAQs: 10 Questions Every Dealer Should Ask

Dealerships can be valued using several approaches, including the income, market and asset approaches. Within each approach, various methods and assumptions may be considered. A dealership valuation typically includes tangible assets such as cash, inventory and equipment, as well as goodwill, more commonly known as “blue sky” associated with the dealership. This FAQ explores the…


Read more
City and hands of a man with handcuffs on a background of us dollars. Fraud, cyber crime concept.
GAO Tax Fraud Report Highlights Gaps in IRS Fraud Risk Management

The United States Government Accountability Office (GAO) released a report titled TAX FRAUD: The Federal Government Loses an Estimated $116 Billion to $304 Billion Annually. The report is noteworthy for several reasons. First, the GAO study attempts to estimate the amount of fraud in the tax gap through use of available data and analytical methods….

Read more
private equity with city background
How AI Is Resetting the SaaS Valuation Multiples in Private Equity and Private Credit

The private credit redemption wave of 2025–2026 has renewed focus on how software and technology assets are valued in an evolving AI environment. Software remains a significant area of concentration across alternative investment portfolios. A quarter of private credit – approximately $112 billion – is in software and technology. On the equity side, software drew…