

This blog has my third and final group of 2025 market performance charts. You can find my review from last year here.
These eight charts bring my total to 20. Each chart tells its own story, and when combined, they present a big picture of where we have been and an inkling of what could be expected in the future.
I will also include all 20 charts in a 100-page booklet that will be available in a few weeks. If you want a PDF when it is available, email me at [email protected] and just put “Stock Market booklet” as the subject. No message necessary.
In the next two weeks, I will provide my opinion of what I think has occurred and perhaps a glimpse into the future. I will also explain the uses of all 20 charts. That will also be incorporated into my booklet.
I believe these charts are tremendous resources, and I use every one of them when discussing investment and financial planning with clients and in my presentations. If you do not want the booklet, I suggest you print these blogs for future reference. The previous charts were shown in my last two blogs, Year-End Financial Benchmark Charts and Graphs for 2025 – Withum and 2025 Stock Charts: S&P 500 Index Performance and Statistics-Part 2 – Withum.
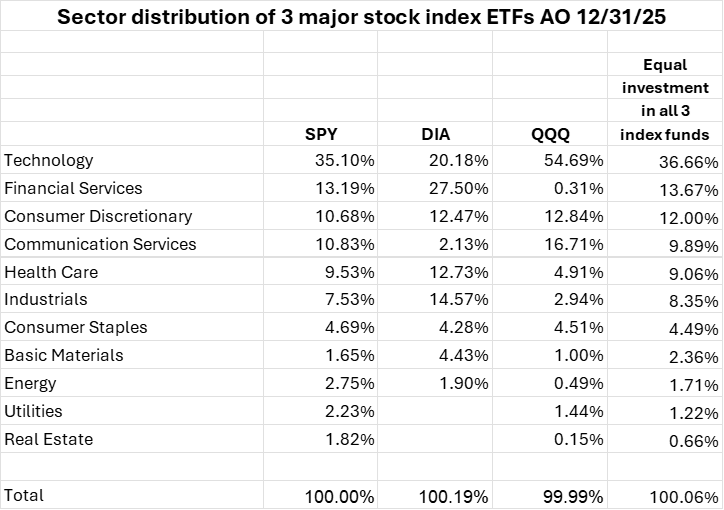
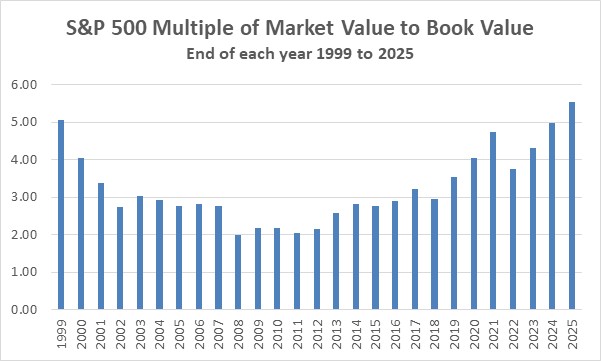
In my use of these charts, questions arise, and occasionally, that provides a reason for adding a chart. That’s how these charts evolved into 20. I also use these charts with my students to teach about investing, present value of money, reasons for the great excess of market value over book value, the value and benefit of diversification and the importance of the role of CPAs in preparing (internally) and auditing (independent CPAs) financial statements.
Enjoy reviewing these charts.
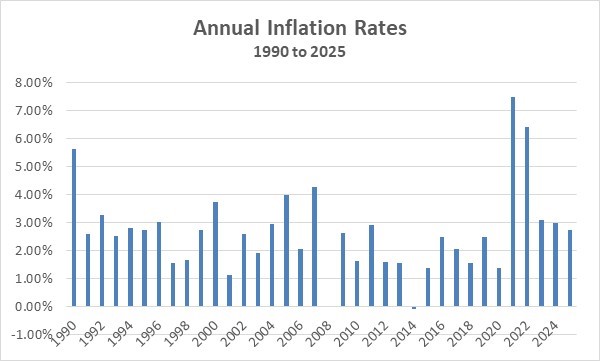
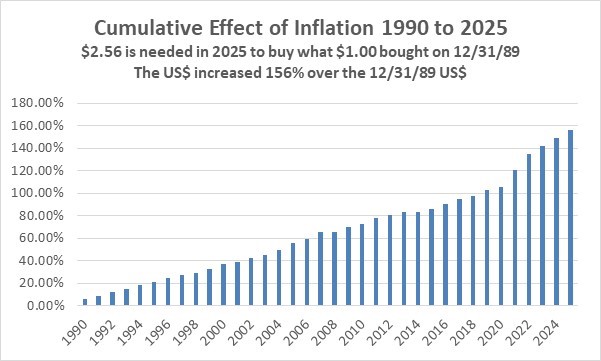
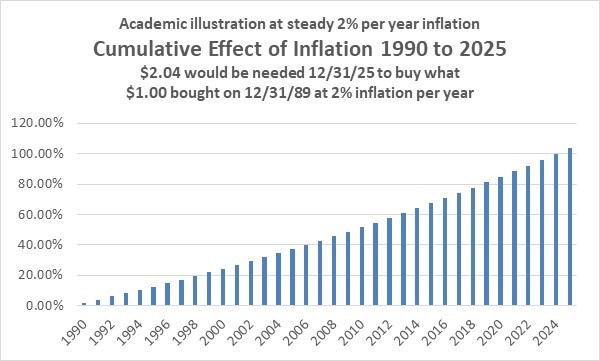
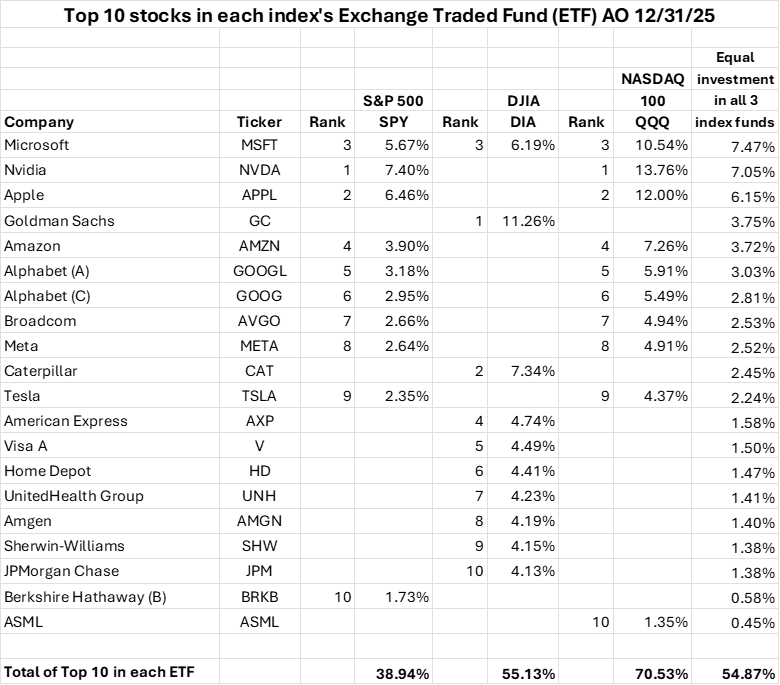
Yearly Stock Market Performance and Inflation Charts
Contact Me
If you have any tax, business, financial or leadership or management issues you want to discuss please do not hesitate to contact me.

