

I’ve had an annual tradition of preparing 10-year charts for at least 45 years.
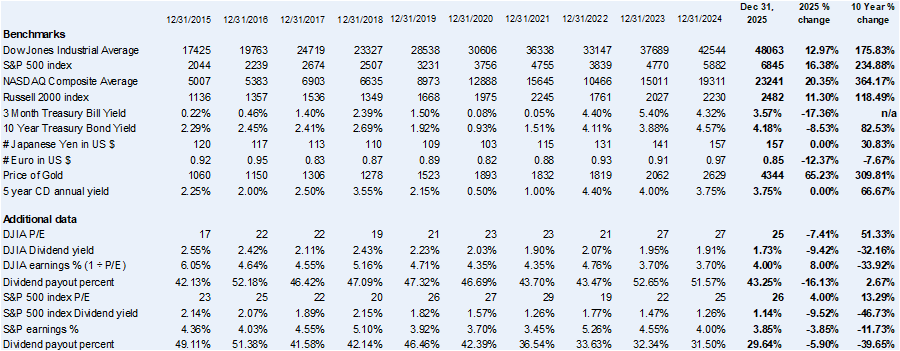
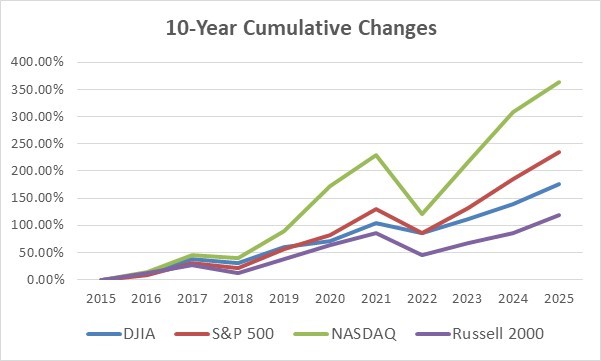
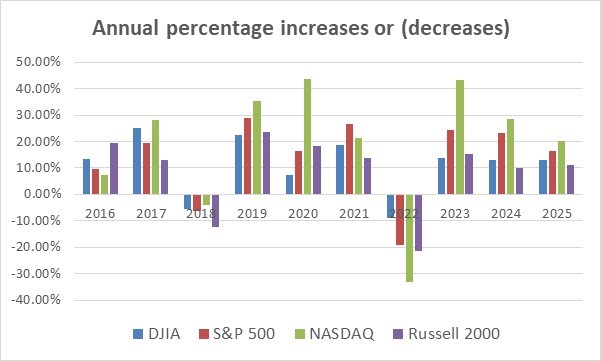
I don’t remember when I started, but it was before spreadsheet software since I recall my secretary typing them and me proofing. I use the charts to assist clients I advise on their financial planning, in speech handouts and with my students. The charts show the last 10 years’ annual and cumulative percentage gains or losses of the major stock market indexes, interest rates, currencies and gold.
The charts include the dividends paid, the price-to-earnings ratios, and the index’s earnings and dividend payout percentages. Some of the amounts or calculations have been rounded to facilitate discussions. These charts are provided for illustrative and educational purposes. No recommendations are made or should be inferred from the information presented. Also, note that past results are no indicator of future performance.
Each year, some changes are made, charts are added or some are deleted. I am working on additional charts and will include them in blogs in the next few weeks. When these charts are completed, I will include them in my updated stock market speech handout. I will also be presenting numerous speeches and webinars, and if you want copies of my handouts, send me an email to [email protected] and put “Your email list” as the subject, and I’ll keep you updated as they become available. No messages necessary.
2025 10-Year Financial Benchmark Performance of Major Stock Market Indexes, Interest Rates, Currencies and Gold
Contact Me
If you have any tax, business, financial or leadership or management issues you want to discuss please do not hesitate to contact me.

