

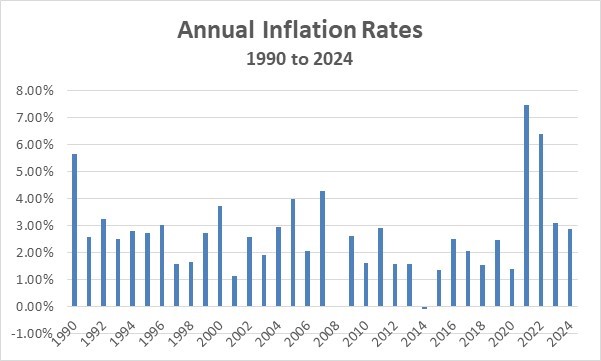
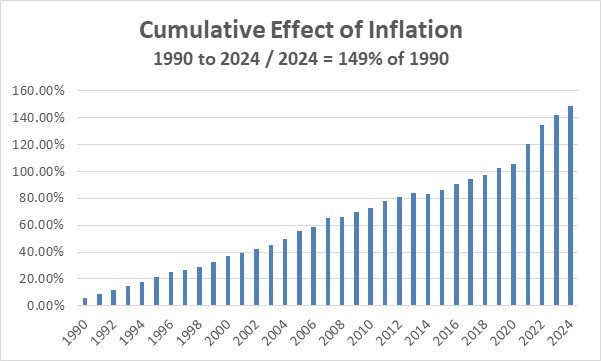
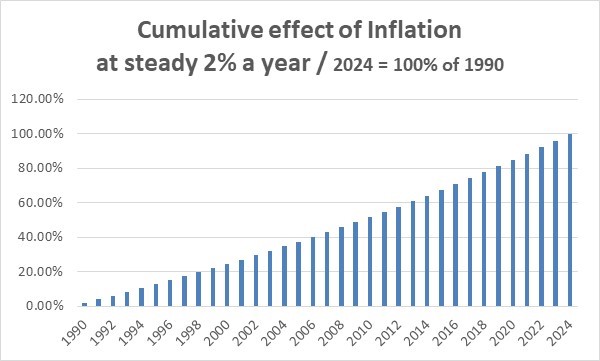
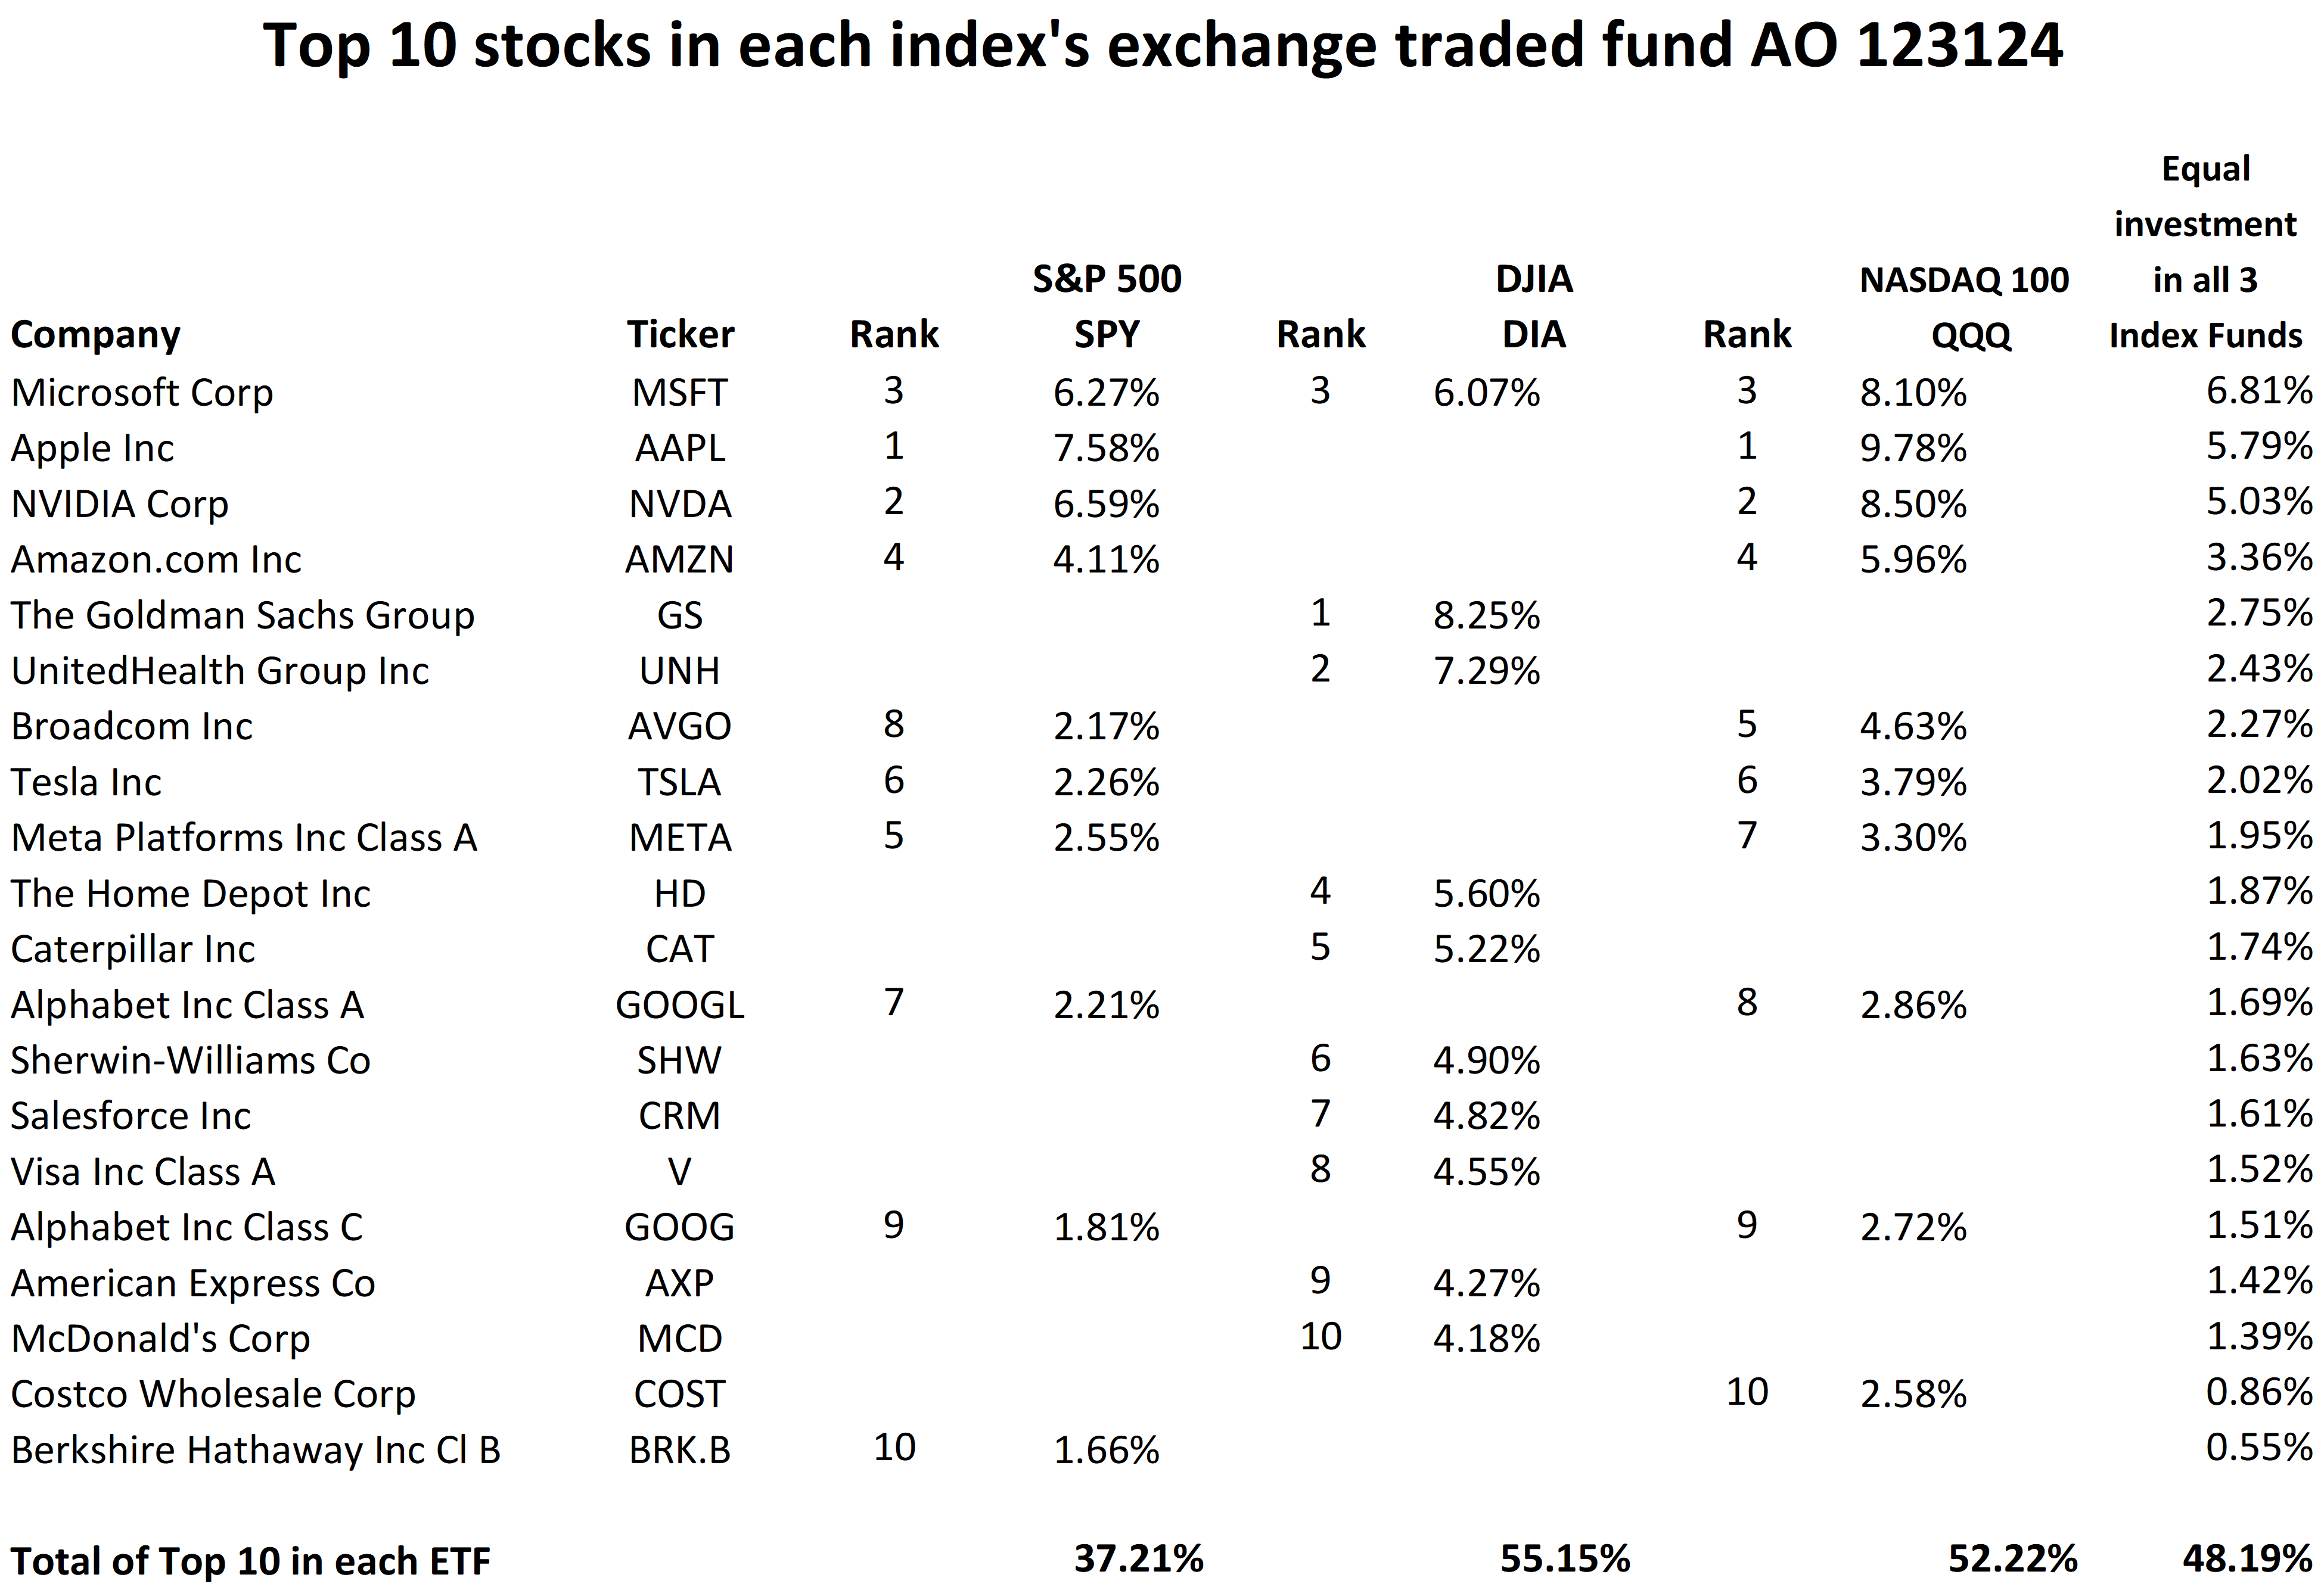
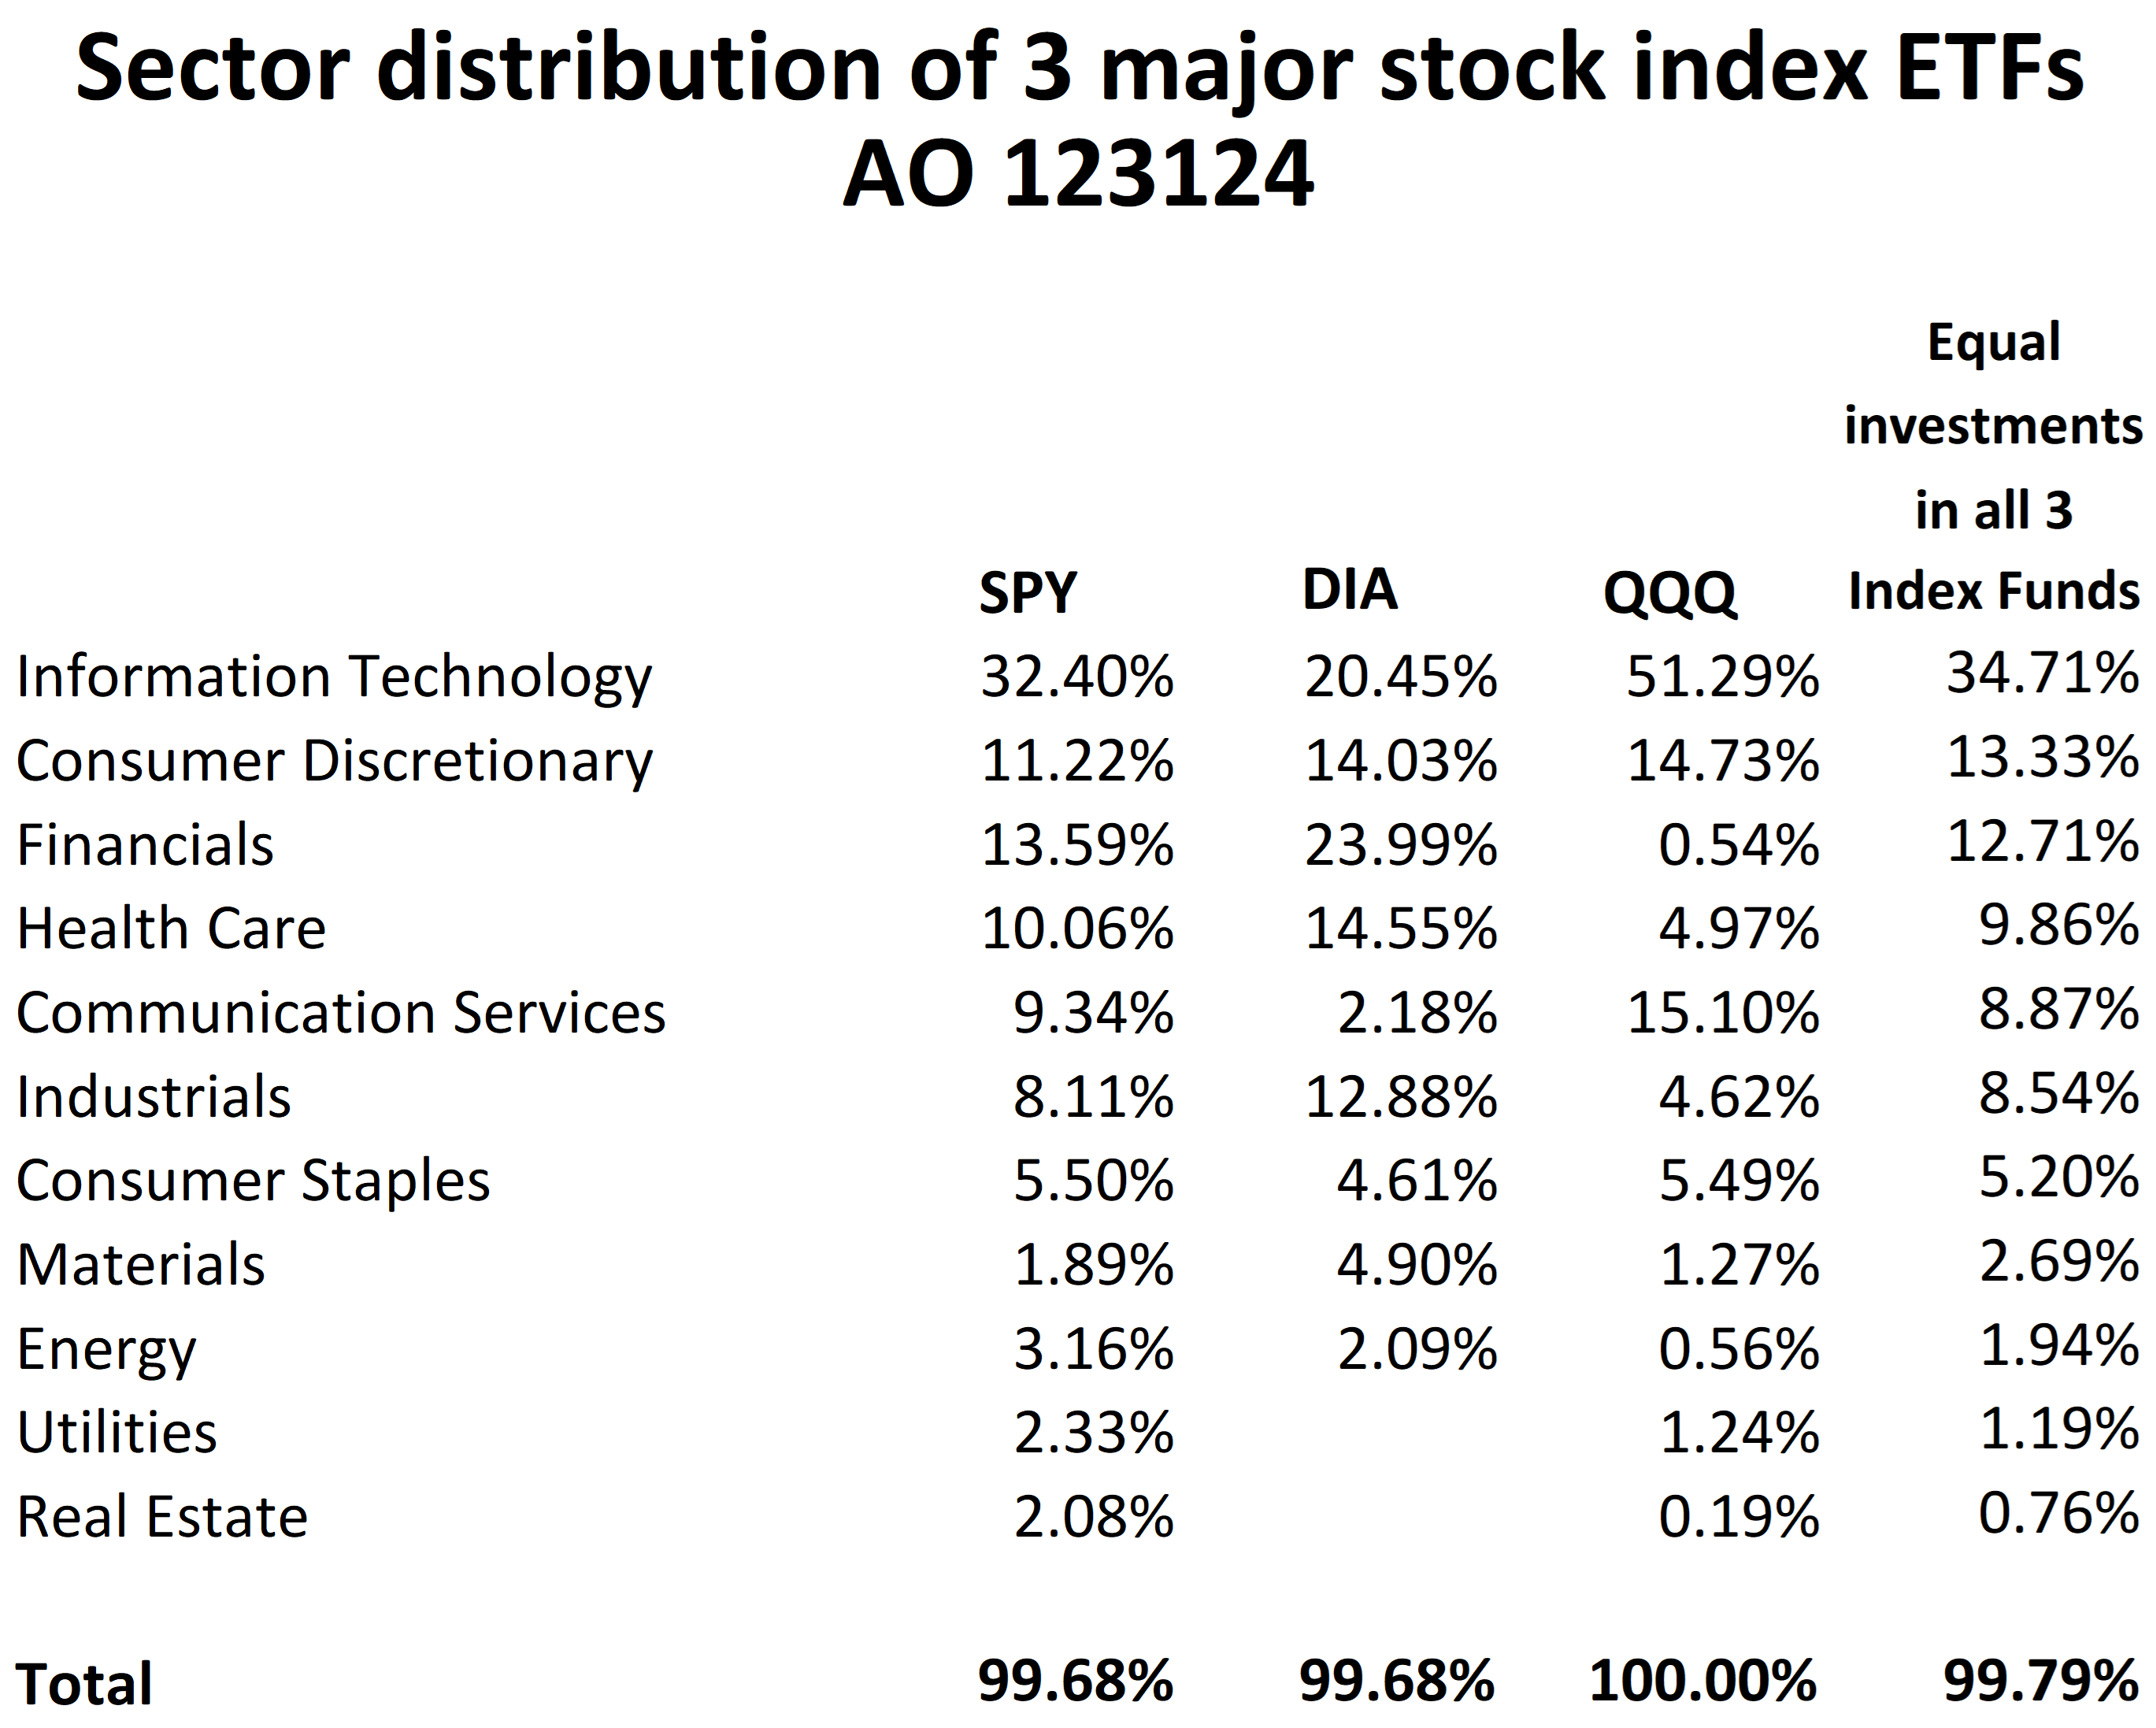
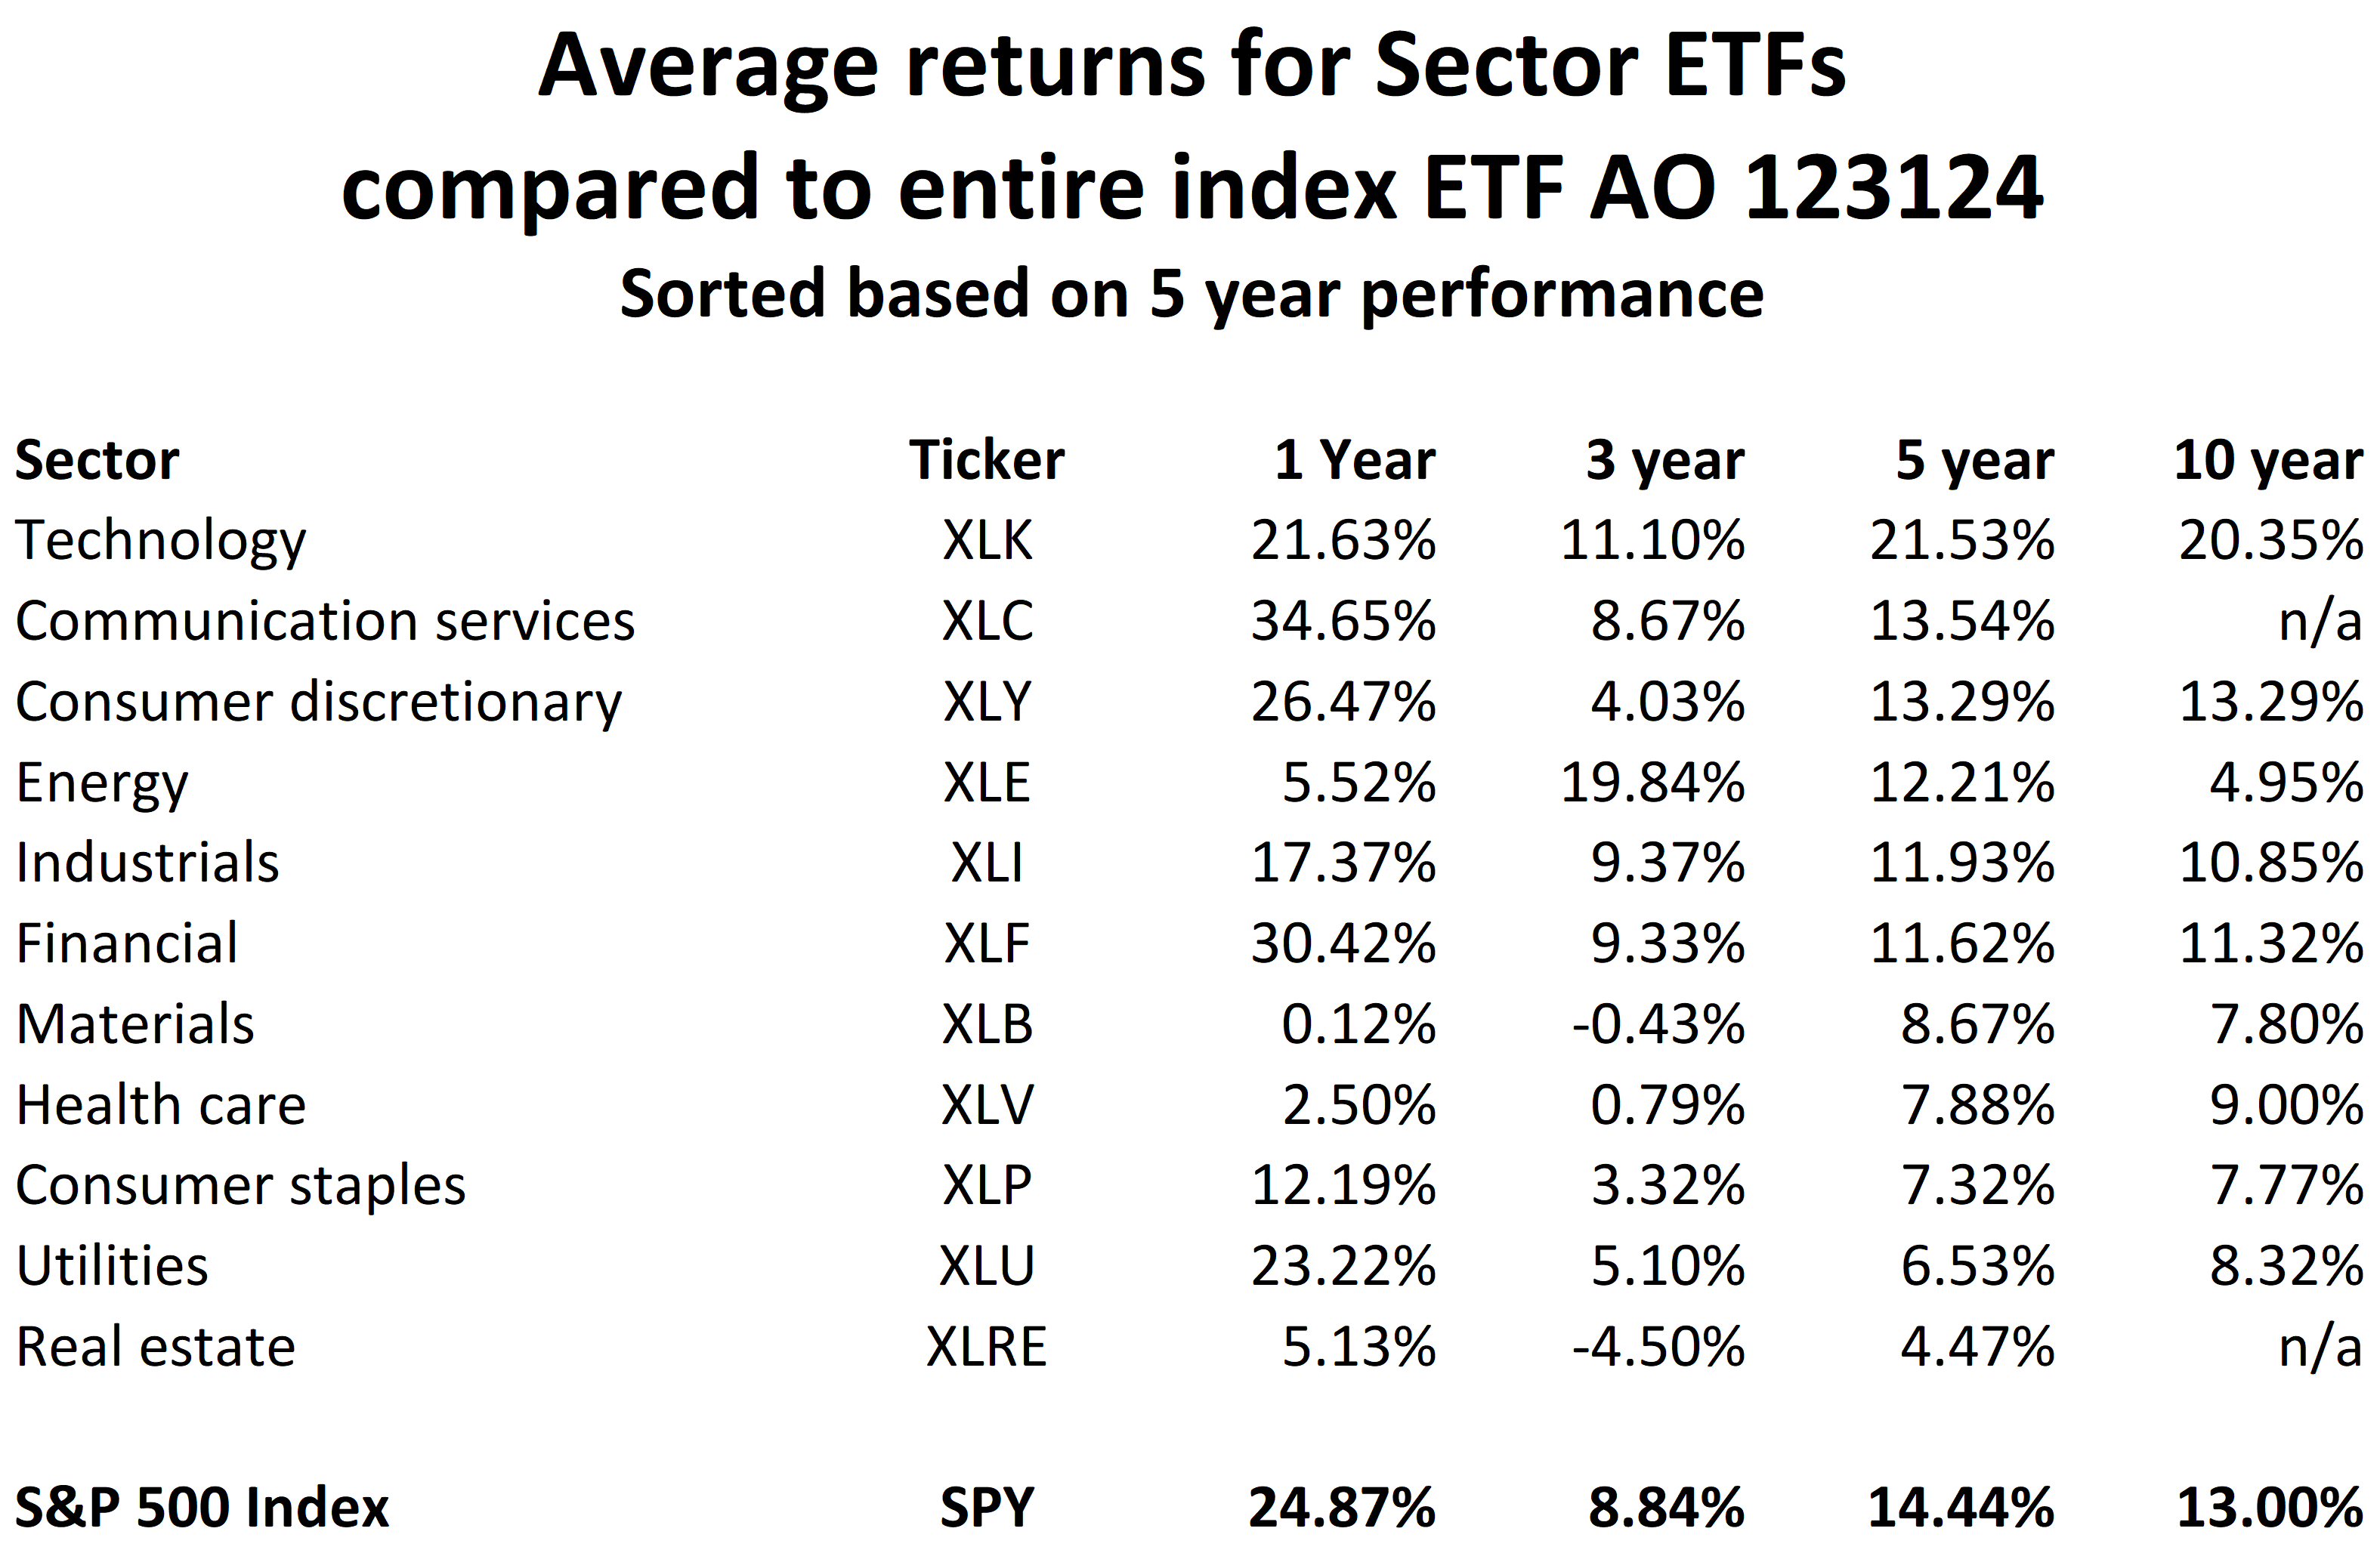
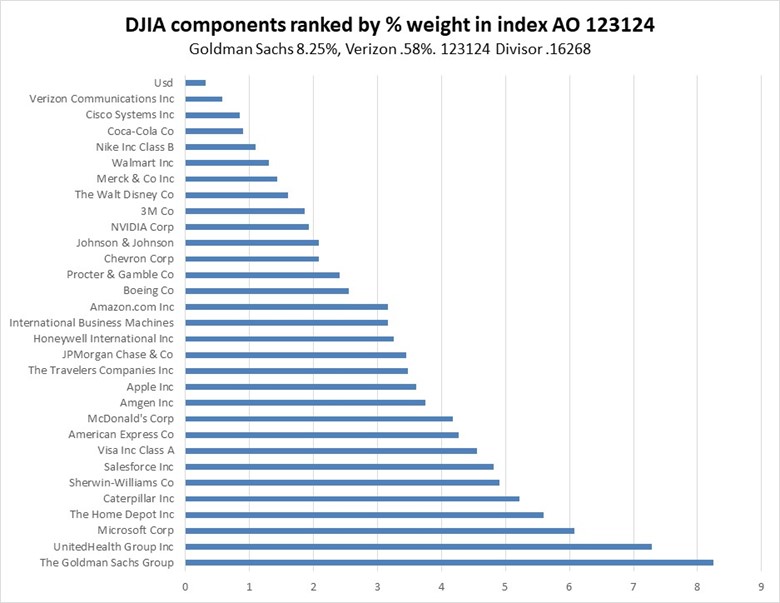
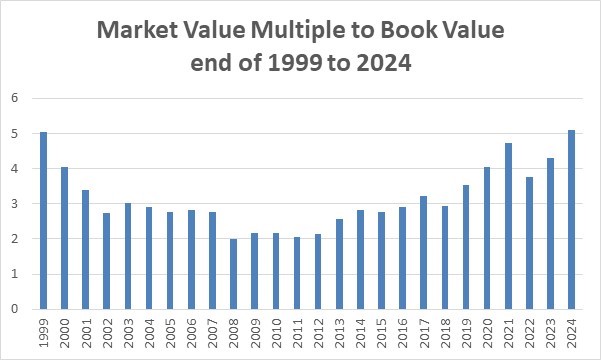
Following are my third and final group of 2024 market performance and related charts. These eight charts bring my total to 20. Each chart tells its own story, and when combined, they present the big picture of where we have been and an inkling of what could be expected in the future. I will also include all 20 charts in a booklet to illustrate my virtual presentation on February 20, 2025 for the East Brunswick Public Library. Registration details are at the end of this blog.
I believe these charts are tremendous resources, and I use them when discussing financial planning with clients and in my presentations. I suggest you print them out for future reference. The previous charts were shown in my blogs on January 9, 2025 and January 22, 2025.
All of these charts, plus many more, will be included in my 100-page stock market booklet and will be the handout for my free live webinar on February 20 for the East Brunswick Public Library as part of my continuing Take a Business Break series. All attendees will receive this booklet. I look forward to “seeing” you there.
If you cannot attend the webinar and want the handout, email me at [email protected], and I’ll email it after February 20, 2025.
2024 Stock Market Performance and Inflation Charts
Contact Me
If you have any tax, business, financial or leadership or management issues you want to discuss please do not hesitate to contact me.

