Resilience
This time last year I was touting the arrival of the Roaring 20’s, a re-coining of the term used to describe the period of rapid economic growth and prosperity post-WWI in the United States. 2019 was an excellent year all around for both private and public cap dealers alike. 2020 looked to start off with the same vigor with Park Place, one of the largest acquisitions in the history of the industry, scheduled to close on March 30. We didn’t know it at the time, but March 30 would approximate the beginning of government restrictions that would shatter economic livelihoods and traditional ways of doing business.
While many industries were irreparably damaged, the negative impact of the pandemic on the automotive retail industry was compressed into a month – and in some cases mere weeks. One large dealer commented that April was two separate experiences, the first two weeks being terrible and the second two weeks being some of the highest volume weeks of their careers. A combination of limited vehicle supply, trimmed headcount and advertising budgets, depressed personal spending (no more eating out for lunch or dinner), and government stimulus money lead to the greatest ever 3-5 months of industry profits. Just like that, an unforeseeable crisis with record-setting unemployment claims resulted in record profits. We will explore some of the financial impacts of the pandemic as we detail what may be in store for dealers in 2021.
Introduction
Many analysts expected 2020 to be a down year for automotive retail. With so much going right for the industry, it seemed the easy way to gain headlines was for analysts to forecast that the end had finally arrived for our bull market. JD Power anticipated “modest declines despite record incentives,” implying that the factory money had lost the ability to “support the underlying volume” or unit sales. In spite of the discussion that perhaps the automotive retail industry had run its cycle or that vehicles had become too expensive, those talking points have been replaced with headlines of record-setting M&A activity.
SAAR
SAAR Chart
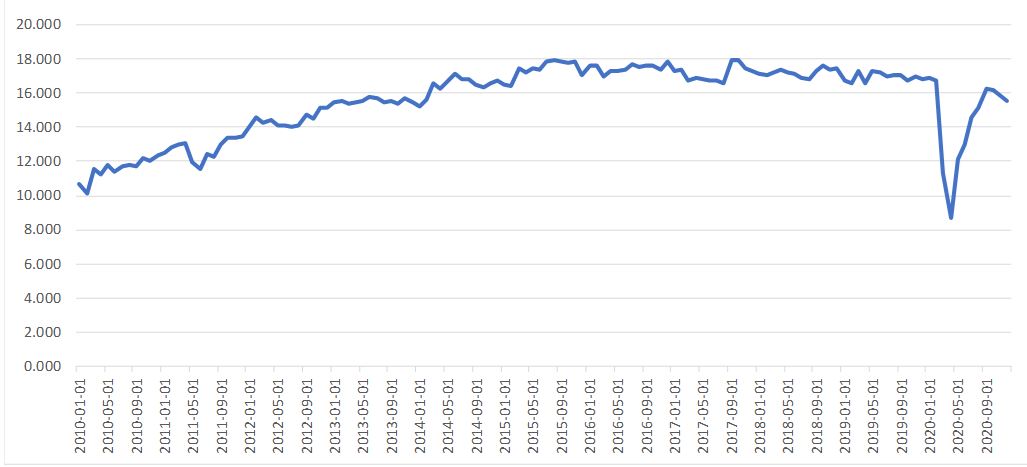
With so much constant emphasis on SAAR, it is worth highlighting a recent article published by Alan Haig, a top auto investment banker, in Automotive News. His argument is that we now have enough evidence to suggest that scarcity of inventory is to the benefit of everyone in the supply chain. The core of his position is that “producing one less vehicle than the market wants” resulted in the highest margins in decades. So why then should we focus on SAAR when the metric is inherently skewed toward ever-increasing sales volumes. Perhaps based upon Alan’s words of wisdom, we should replace SAAR and days’ inventory as the barometers for industry health.
Manufacturer Winners and Losers
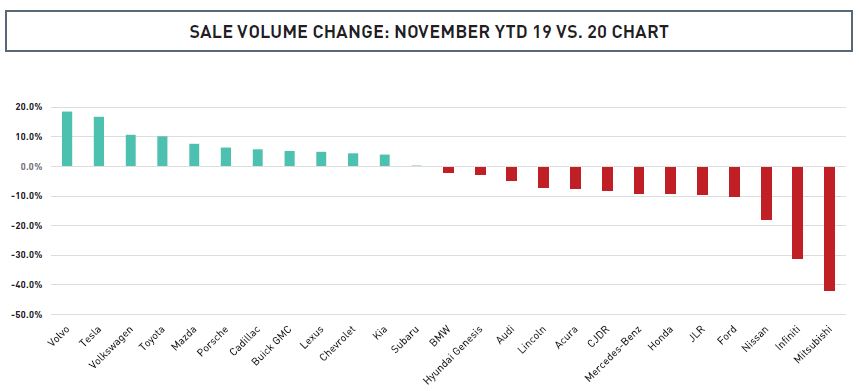
If the past year was almost universally good for the dealers, it was at best mixed for the manufacturers. Overall, total unit sales were down around 2.4%. The pain of that volume decline, however, was spread unevenly with some manufacturers seeing deep double-digit decreases in volumes. Most obviously the volume losers disproportionately reflect sedan-heavy vehicle offerings, while the biggest winners are those brands that have embraced innovation. Tesla, Volvo, Mazda and Porsche have all invested heavily in their current vehicle offerings. Furthermore, Mazda is invested in their dealer network through the implementation of substantial factory dollars, both for achieving sales volumes as well as image compliance. Many Mazda dealers we talk to are happy with the brand. Meanwhile, Nissan and its sister luxury brand, Infiniti, struggled to find relevance and inventory, which ironically has benefitted many dealers now that they can generate an honest gross on new vehicles.
Some of the declines were outside of the manufacturers’ control, including shelter in place orders where the factories are located as well as from where parts are shipped. We recently heard of a customer waiting nearly 8 months for a custom ordered Mercedes GLS. If 3,000 parts go into a Ford F-150, then it only takes the delay of one part to disrupt the entire process. This has been a focus of recent AutoNews articles discussing the shortage of microchips. When you consider all of the facets of manufacturing a vehicle, and all of the countries, people and steps they involve, it is a testament to the industry that production didn’t drop further.
For questions or additional insight, contact Withum’s Dealership Services team to help address your dealership challenges.
Used Vehicle Trends
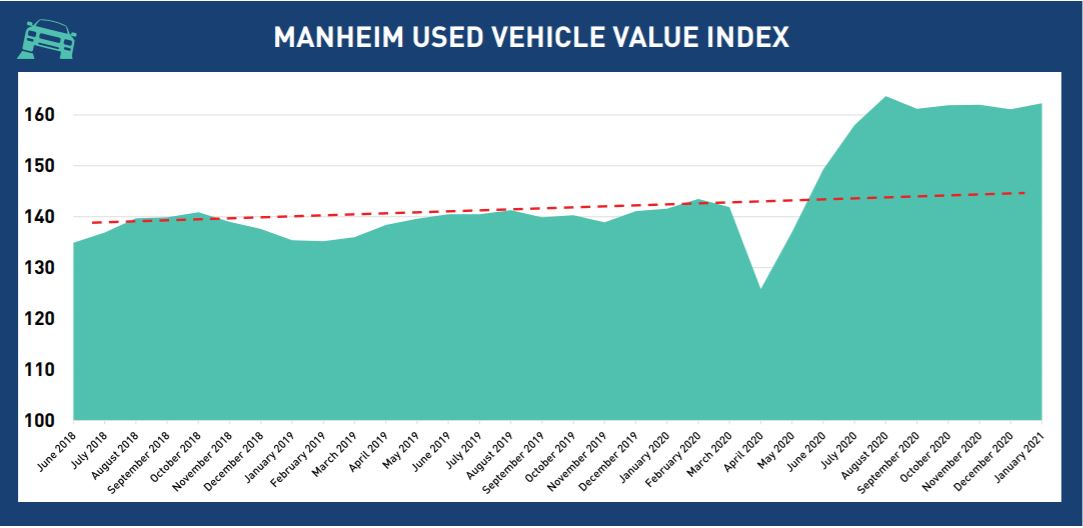
In 2019, the hot topic among dealers and auto journalists was the renewed focus of new franchised dealers to retail preowned vehicles. In 2020, it was how many dealers kept their doors open. In the absence of new inventory, procurement of used inventory became paramount. In fact, franchised car dealers retailed 4.7% fewer preowned vehicles in the first 11 months of 2020, compared to the prior year. This procurement of used vehicles was made even more difficult by companies like Carvana making online, sight-unseen offers for vehicles at prices many dealers couldn’t support. The question that remains today is what will happen to used vehicle prices in the near future.
Above is a chart of the last 30 months of the Manheim Used Vehicle Value Index superimposed with a trendline of vehicle values excluding the pandemic period. The shaded area above the trend line beginning in June 2020 illustrates the amount of vehicle pricing solely related to supply chain disruptions, which amounts to approximately 15% over the trendline. It is worth noting that this is for the average vehicle, with pickup trucks more than 25% above their normal trend while midsized cars indicated the least amount of supply pricing exposure. Our suggestion to dealers is to hold only the inventory that is necessary and fast-moving so that they don’t get stuck with vehicles submerged underwater. One luxury dealer said that they plan to hold high-end used inventory less than 30 days, especially Porsches that are commanding prices that aren’t dissimilar from their original stickers.
Market Data
New
- New vehicle volumes were universally down across the country. The data suggest that the pandemic supply chain challenges hit both private and public cap dealers, although the public groups did report declines in new volume that were around 30% steeper than the average private cap dealership. This is partially owed to the fact that the public are relatively more luxury heavy than the average dealer, with luxury dealers likely to have vehicles imported from Europe. It may also be the more entrepreneurial and faster acting nature of private cap dealers to stock up on inventory.
- If the public companies indicated greater declines in new volumes, they also reported much stronger grosses than the average private dealer. Public company gross profit on new vehicles, which is a little more consistently reported than at private dealerships due to their adherence to GAAP accounting principles, increased by an average of 22% in the first nine months of 2020 compared to the nine months of 2019. Two of the groups experienced PVR increases of more than 30% (Asbury and Group 1), while the average private dealer only saw an increase in PVR of 18% (through November). Encouraging in the data was that the increase in private dealer PVRs was driven by true front end gross and not OEM dollars.
Used
- Public groups and private dealers alike experienced declines in used vehicle volumes, with the exception of Lithia, which was able to eke out a small 2,000 unit increase in used volume. The average public group declined 10%, excluding Lithia, at the same time private dealers experienced only about half the percentage decline. Again, this may be a testament to the more entrepreneurial nature of private dealers and their ability to gamble or be innovative with concepts. In the near term, it is likely that average used volumes remain consistent as the economy works through the current pandemic.
- The general theme we have heard from dealers is that it’s been hard to not make money retailing vehicles – even clunkers. One of the dealers we spoke to said that he was able to wholesale vehicles for more than he thought he could get at retail. That being said, Sonic notched a 4% decline in used PVR (6% decline when you measure TTM over year-end 2019). From Sonic’s earnings call, it seemed like operational struggles involving a squeeze on the floor plan may have driven some executive decisions in the third quarter.
The challenges that faced Sonic may be indicative of what many dealers may face in the coming months. If used vehicle pricing returns to the trendline suggested, then banks may issue significant curtailments to follow the value of their collateral. Dealers may find themselves in the painful spot of having to come up with cash to pay down 10-20% of their used floor plan. This potential trouble spot can be mitigated by keeping an eye on inventory turns.
F&I
- F&I has long been an area of strength at the public groups. Each of the groups continued the trend by posting solid PVR gains with AutoNation reporting PVR gains north of 10% for the first nine quarters of the year, with the average gain of the public being 9%. Penske is disproportionately represented by luxury brands, which are overwhelmingly leased to consumers and do not present the same F&I product opportunities as other franchises. Excluding Penske, the average F&I PVR of the public groups is now $1,867 per copy. That is $155 greater than 2019. We have heard of many private dealer groups eclipsing $2,000 per copy by exploring new vendor relationships and holding their F&I professionals accountable. These F&I profits are in addition to the captive insurance profits that many dealers operate. Evidence, however anecdotal, appears to indicate that the average dealer benefits from moving their F&I process online. A question we often wonder is whether the top F&I performers, who can generate close to $3,000 PVR, will continue to experience their same relative success when customers are in the driver’s seat with online retail. Average software and processes will generate average results.
Fixed Operations
- The public groups reported average fixed ops gross profit contraction of 9.6% in Q3 2020 compared to Q3 2019. Taken as a whole, gross margin remained largely unchanged over the same period. Group 1’s President of Operations, Daryl Kenningham, said on a recent earnings call that service for both customer pay and warranty has returned to a normal pace and will continue to improve along the pre-COVID trend. Private dealers fared about the same as their public counterparts.Historically, GMs and dealers overwhelmingly cut their teeth on the sales side of the dealership. With many groups reaching critical size for executive teams, this has allowed for some of the large sophisticated dealers to bring in professionals dedicated to running fixed ops with the same zeal as the industry has done on the front-end. Unfortunately, the decline in total vehicles retailed in 2020 will likely drag slightly on UIO’s and repair order volume in the next few years. This will depress fixed ops, but not meaningfully.
Economic Indicators
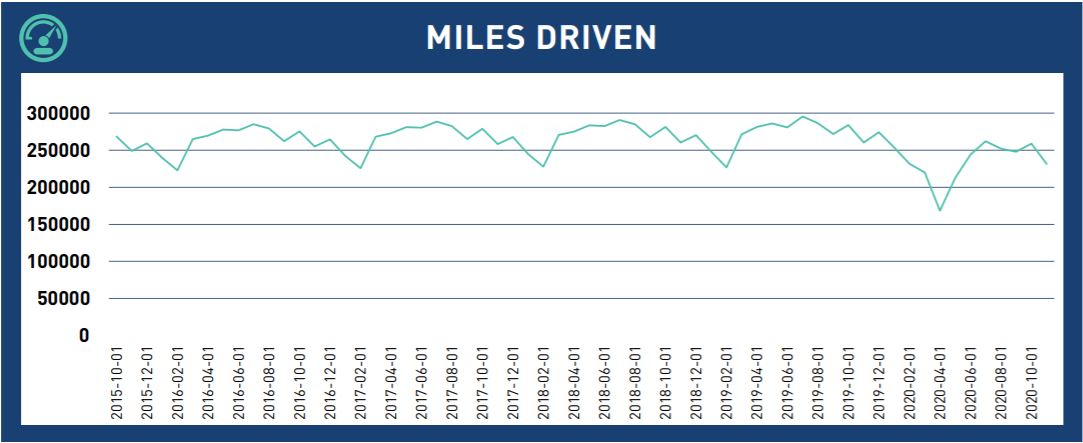
Miles Driven
US driving habits had been predictable prior to COVID with a steep decline in April. While the miles declined greatly, there were still nearly 170 million miles driven in April. By October 2020, miles driven was only off by 11.1% compared to the prior year on a national level. At the regional/state level, the Northeast miles driven are still down 11.5% from the prior year. This would imply that service departments in Florida should be faring better than service departments in New York.
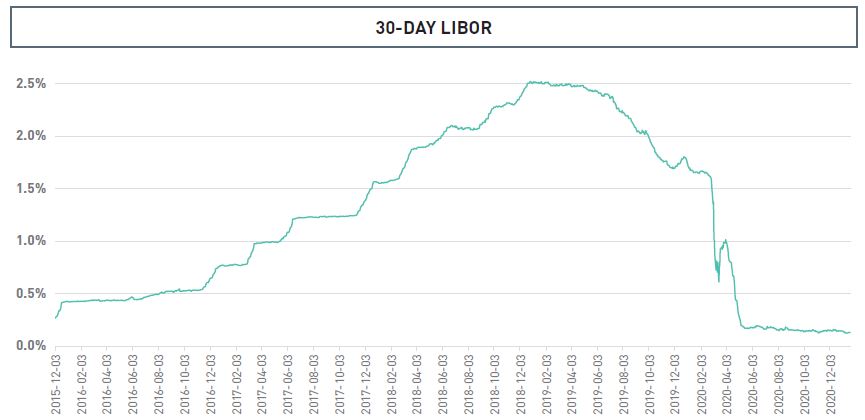
Interest Rates
After years of rising interest rates, 2019 and 2020 saw abrupt declines in the benchmark LIBOR rate. This is a welcomed move for our dealers as lower interest rates positively impacts floor plan costs, consumer budgets and store financing (acquisition and mortgage debt). This allows dealers large and small to reach on their acquisitions, leading to a tremendous level of interest in acquisition opportunities. Specific to the data graph shown, LIBOR is probably the most commonly quoted benchmark when it comes to floor plan and acquisition debt interest. If this trend continues, we expect more dealers to start seeing profits from their floor plan assistance credits. In fact, the average dealership generated around $86k of earnings from floor plan credits during the past 12 months, despite the lack of inventory.
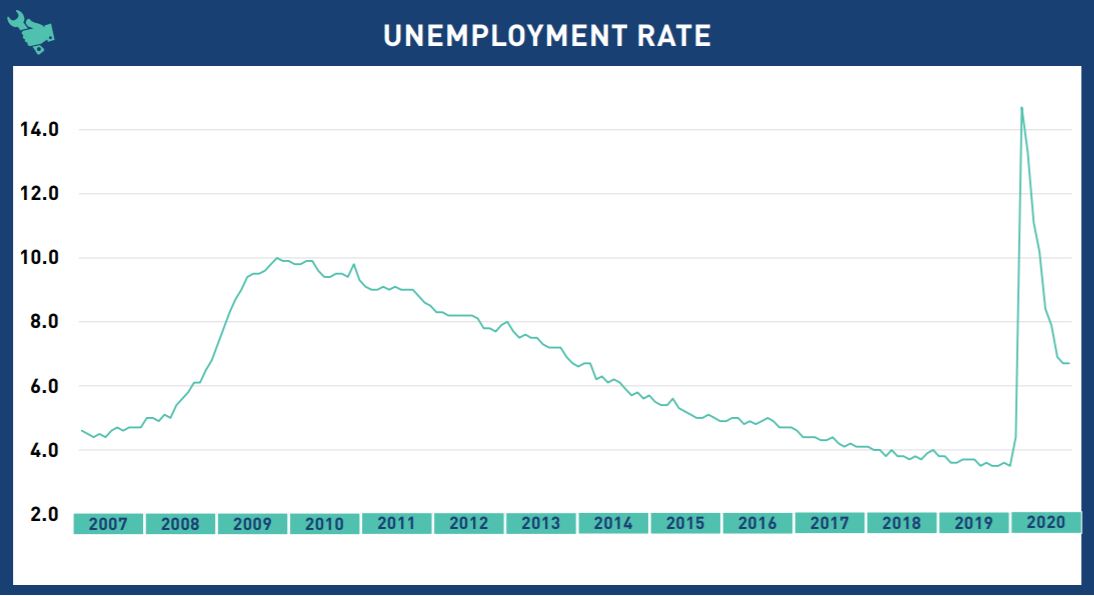
Employment
Until 2020, the US economy and job market had rarely been better. Last year I wrote that we were entering a new Roaring 20’s. The unemployment rate had been below 4% for nearly two years. In fact, we need to look back more than 50 years to find a comparably low unemployment rate. March of 2020 catapulted us beyond the Roaring ’20s and into the depths of the late 20’ – the Great Depression – with unemployment rates soaring to nearly 15% by April 2020. That is the headline rate most commonly used by the media.
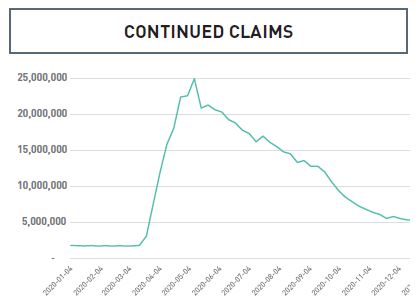
An equally insightful measurement of unemployment is the continued claims of insured unemployment. This data tracks those who have already filed an initial jobless claim and continue to receive benefits. In this data, we can see the impact of the Paycheck Protection Program, with nearly 4 million workers being added back to payrolls in the second week of May. The graph shows a steady improvement of the labor market until the next major event, the end of the $600 unemployment benefit on August 1. In the two weeks prior and the two weeks after the expiration of the $600 incremental benefit, continuing claims declined by 2.5 million. Since that time, continuing claims have declined another 11 million jobs. Even without additional stimulus programs, the economy has been roaring back to life. With the recent passage of The Economic Aid to Hard-Hit Small Businesses, Nonprofits, and Venues Act, which is providing unprecedented support to many industries, we see no reason to believe that unemployment will do anything but continue to decline.
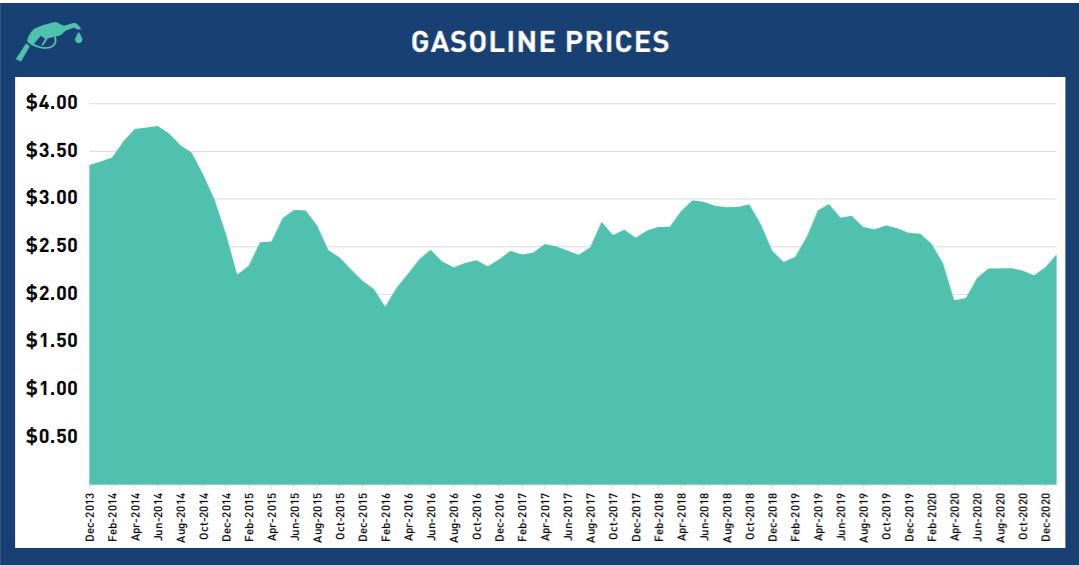
Gas Prices
Thanks to innovation in domestic oil production, such as fracking, the US became a global net exporter of oil for the first time in our history. Since 2012, gasoline prices in the US have declined 32% while the fuel economy of current model year vehicles is greatly improved over the same period of time. Average fuel prices haven’t exceeded the $3 threshold since October 2014. Even with the decline in miles driven since the beginning of the pandemic, gasoline prices have continued to feel downward pressure as OPEC members continue to overproduce in light of their own self-interests.
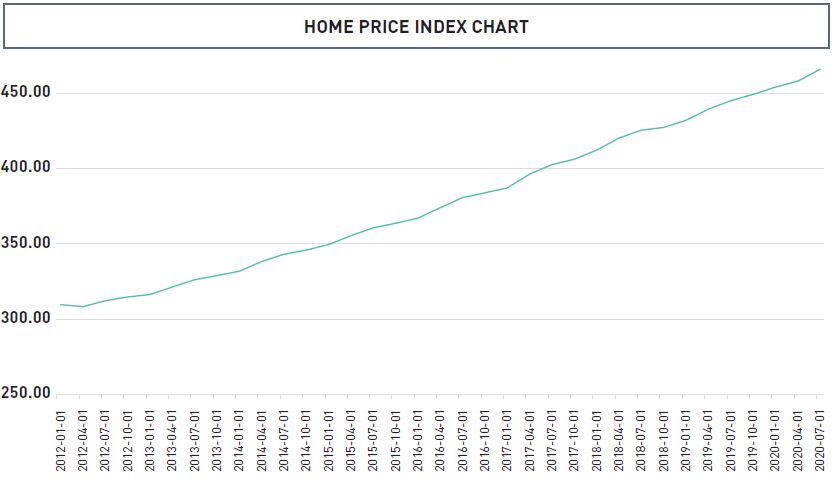
Housing
Houses represent the primary source of wealth for the average American family. Gains in home values, and implicitly gains in homeowner equity, translate to purchasing power of new and used vehicles. The 50% increase in the house price index since 2012 is a positive factor for consumer financial strength and vehicle affordability.
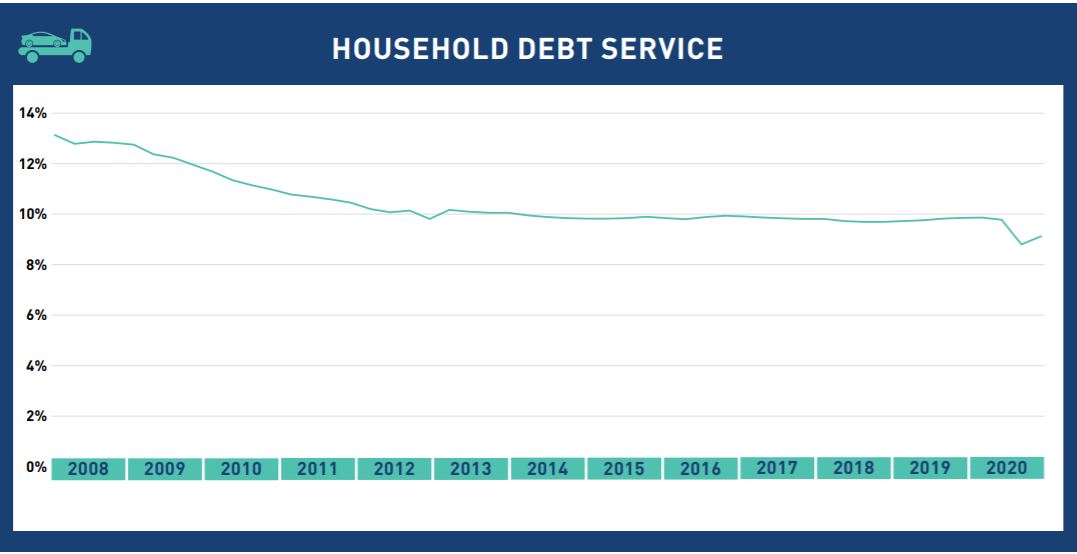
Consumer Financial Strength
For the latest data available it appears that personal income rose 3.8% in 2020, while consumer spending is down 1.3% from a year ago. This means that despite the media coverage of economic woe, dealership consumers have rarely been stronger. The data is reinforced by an analysis of consumer debt levels, which indicates the average consumer is in a much better place than they were during the absolute peak of the last boom in 2007 and immediately preceding COVID. The shelter in place orders and social distancing have forced many American families to forgo vacation and eating out, saving substantial amounts of money. While it may defy the media’s headlines, the American consumer today is healthier than any time during the past five years. This suggests that this pandemic rally still has the momentum to continue.
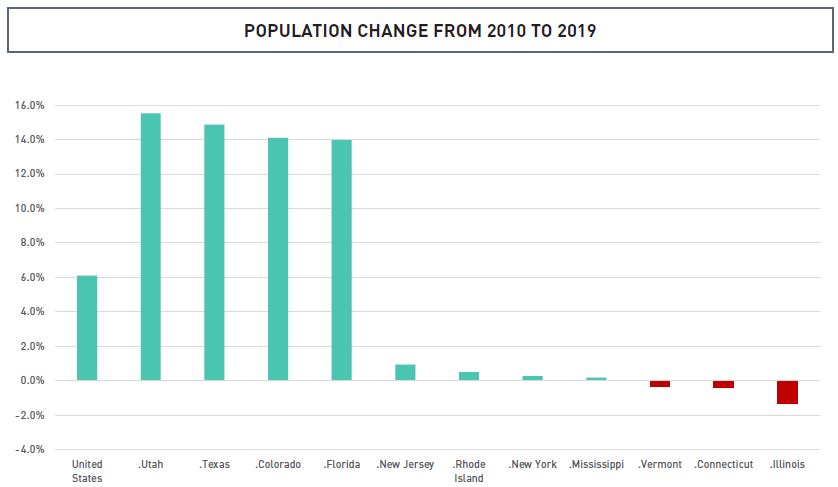
Location, Location, Location
It should come as no secret that the US population is larger than it was 10 years ago. What may come as a surprise to some is that the growth in population and jobs has been greatly uneven among the states. The media reports of COVID migration is simply an escalation of a longer overarching trend that states which value entrepreneurship and individual liberties have gained the lion’s share of the last decades’ worth of growth. For example, Texas has added a Connecticut’s worth of population since 2010. With the financial distress now experienced by some higher regulation states, such as Illinois where the Chicago mayor is changing traffic cameras to issue speeding tickets for vehicles traveling just 6 MPH over the speed limit, we don’t expect the trend of mass migration to stop in the foreseeable future. This is consistent with what we are hearing from dealers that are overwhelmingly seeking investment opportunities in the states of Florida and Texas, beyond the level we are used to.
contact Withum’s Dealership Services team to help address your dealership challenges.
Dealership Services