
Creating effective reports and dashboards in Microsoft Dynamics 365 Business Central involves a clear understanding of your business needs, leveraging built-in tools and optionally integrating with Power BI for advanced analytics. A well-structured Business Central report ensures stakeholders have access to the right metrics at the right time. Whether you are learning how to create a report in Business Central or exploring dashboard customization with Power BI, the goal is to design insights that are both impactful and easy to use.
Here’s a practical guide to help you design impactful, informative and usable Business Central reports and dashboards:
1. Understand Your Reporting Goals and Audience
Before building reports or dashboards in Business Central, clarify what key metrics and insights your users or stakeholders need. For example, finance teams may want cash flow and aging reports, while operations want inventory and production KPIs. Define:
- Who will use the reports/dashboards?
- What decisions will they support?
- What data is critical to include?
2. Start with Built-in Reports and Layouts
Business Central offers many out-of-the-box reports and dashboard options, which can be customized to fit your needs:
- Search for Report Layouts in Business Central to explore selectable templates.
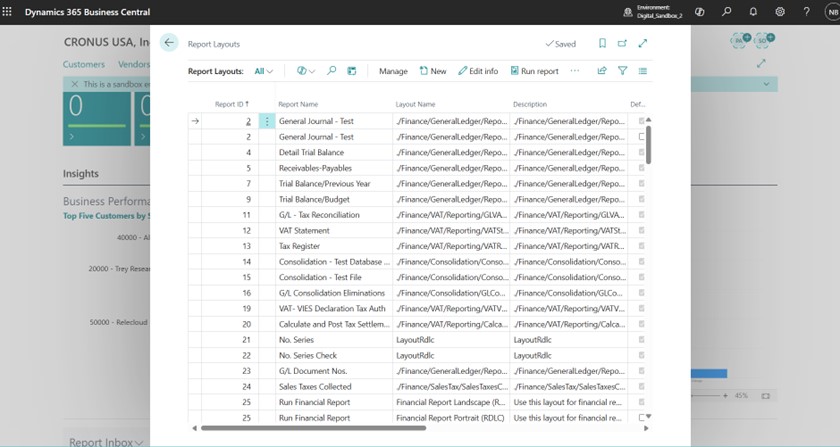
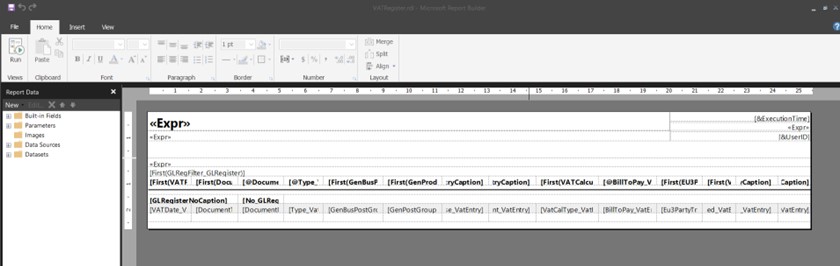
- Create or modify report layouts using external tools like Visual Studio with the RDLC Report Designer extension. Business Central does not support direct RDLC layout editing in its UI. However, you can rename an .rdlc file to .rdl to edit it using Microsoft Report Builder, which only supports .rdl files
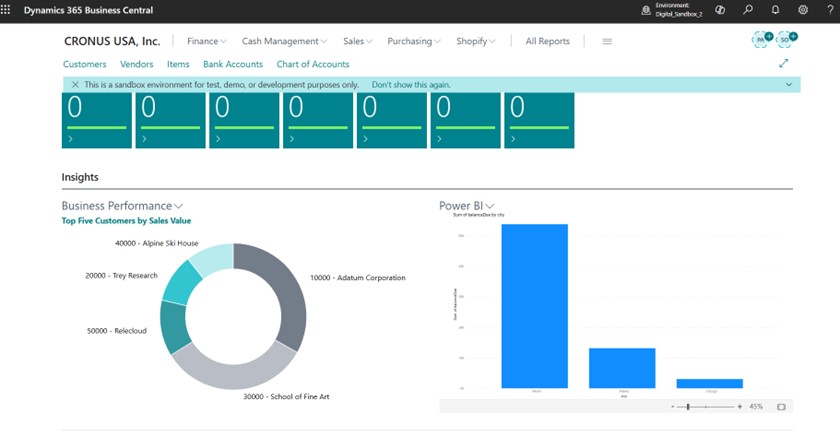
3. Customize Dashboards Within Business Central
- In Business Central, the Role Center acts as your personalized home page, giving you a quick overview of the information that matters most to your role.
- Add useful components like charts, lists, cues, and even embedded Power BI reports or tiles to bring your data to life.
- Tailor the layout to fit your workflow. Users can personalize their own view, while admins can roll out consistent designs by customizing profiles for different roles.
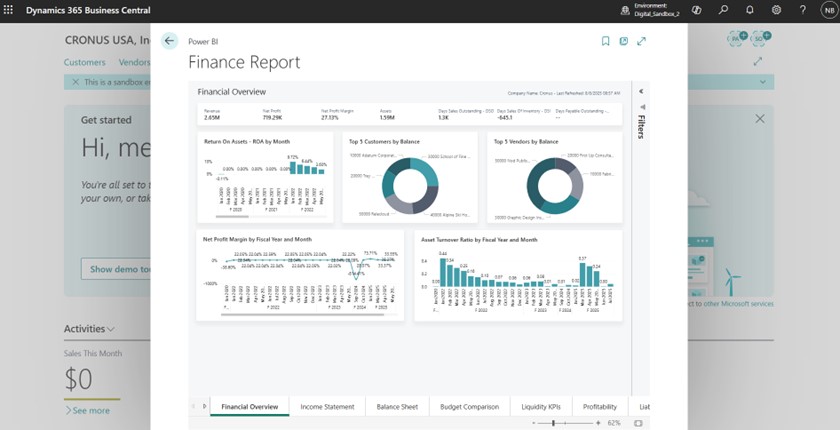
4. Leverage Power BI for Advanced Reporting and Dashboards
Power BI takes your Business Central data beyond standard reports, giving you interactive dashboards, KPIs, and drill-down analysis for better decision-making.
- Connect Power BI Desktop to Business Central using built-in APIs or OData web services. This lets you pull in tables like customers, sales, and inventory for reporting.
- Design rich, interactive reports with filters, drilldowns, and KPIs in Power BI Desktop. You can even apply the Business Central theme for a consistent look.
- Publish your reports to the Power BI service for secure, organization-wide access. Once published, these reports can also be embedded back into Business Central Role Centers for a seamless experience.
5. Extend and Automate Reports in Business Central
In addition to standard reports, Business Central provides powerful technical capabilities to extend and automate reporting:
Report Extensions
Since the Business Central 2021 release wave 1, you can use report extension objects to customize existing reports without modifying the base application code. This allows you to:
- Add columns to existing data items or add new data items.
- Implement custom triggers to enhance report logic.
- Add additional custom report layouts (Excel, Word, RDLC).
Report extensions ensure your customizations remain compatible with upgrades since they do not alter the original report definition. They are developed using AL language in Visual Studio Code and can modify the dataset, layout, and report behavior.
Automation Techniques
Business Central supports automating report generation and distribution to improve efficiency:
- Schedule reports at regular intervals or trigger them from workflows.
- Export reports automatically in formats like PDF, Excel, Word, or XML, facilitating data sharing and system integrations.
- Use Power BI for real-time dashboard refreshes and interactive reporting without manual intervention.
- Programmatically control report generation and output using AL code extensions that handle file exports and customize report execution.
Together, report extension and automation capabilities empower advanced users and developers to tailor Business Central reporting to complex business needs, integrating insights delivery into daily operational workflows.
6. Best Practices for Effective Reporting
- Prioritize clarity: Use simple visuals and avoid clutter.
- Use filters and parameters: Allow users to refine data by relevant dimensions.
- Regularly update: Ensure data and layouts keep pace with business changes.
- Enable collaboration: Share reports with commentary to foster discussion.
- Train users: Help stakeholders interpret and interact with reports confidently.
Mastering these steps and leveraging both built-in and technical capabilities will help you create effective, insightful, and automated reports and dashboards in Business Central, supporting better business decisions.
Takeaways
Creating effective reports and dashboards in Microsoft Dynamics 365 Business Central requires more than technical setup. Success comes from aligning reporting with business goals, choosing the right tools, and ensuring data is presented in a way that supports confident decision-making. By using Business Central’s built-in features, extending capabilities through integrations such as Power BI with Business Central and applying automation, organizations can deliver timely, clear and actionable Business Central reports and dashboards that maximize the value of their ERP investment.
Contact Us
Ready to optimize your reporting strategy? Withum’s CRM and ERP Consulting Services Team can help you design dashboards, automate reports and connect Power BI for powerful insights.