Basic Concepts on Valuing Earn-Outs – Part IV
An additional challenge is that valuation practitioners, auditors and regulators like it when all the rates used for discounting generally fall near each other or near other observable data points. There is an understanding that goodwill rates of return may be 5 or 10 percentage points higher than a weighted average cost of capital, but such differences may be explained away by the specific benefit of some synergistic deal aspect. When the subject discount rate used for the earnout in a risk-adjusted framework has to be 70 or 100 percentage points higher than the WACC to be valid, that is where the poor optics out-weigh academic reasoning. The rationale for the disparity is covered in the previous series article and The Appraisal Foundation Working Group 4’s early release draft on valuing contingent consideration, but let’s see it in action here.
For example, suppose the earn-out is based on Revenue Retention. If the retention based payment from acquisition date to payment date is:
- Less than 60 percent = Payout is $0
- Greater than or equal to 90 percent = Payout is capped at $50 million
- Greater than or equal to 60% = Payout calculated as Min([(Retention Rate – 60%)/30% * $50 million],$50 million)

Let’s go through some of the key assumptions assuming we estimate the earn-out value using an Option Pricing Method (“OPM”). Please recall that one of benefits of using an OPM is that the distribution around the actual metric is assumed to be lognormal. While this is a simplifying assumption, it is applied in other financial instrument valuation models. Specifically, a lognormal distribution is typically used in the valuation of options and other instruments where a stochastic environment must be considered (e.g. warrants, convertible bonds, convertible preferred equity). Another key consideration is the discount rate. Since the OPM uses a risk-neutral framework, the discount rate is the risk free rate for the term of the earn-out.
Our sample earnout can be deconstructed into one long and one short call option, where the inputs look like:
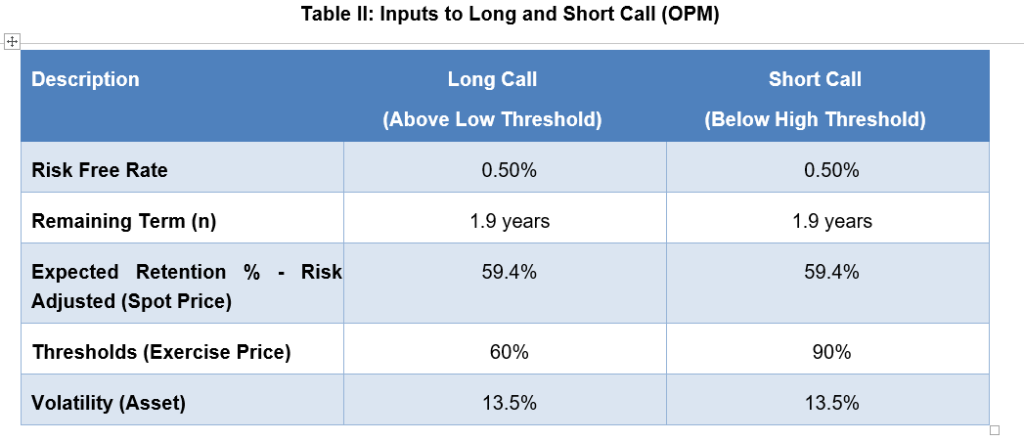
Please note that since we are solving for the percentage Retention Rate above 60% and below 90%, we will use the OPM to solve for the retention rate (as opposed to the payout amount directly). We will translate the result into the payout amount later. In addition, the volatility we used is an asset volatility since the reference metric is revenue-related. Lastly, please note Management told us they expected a 75% retention rate, but we’ve discounted this amount by a 15% WACC to estimate a risk-neutral Management figure.
The option model series results in the expected retention rate in a risk-neutral environment to be around 64%!
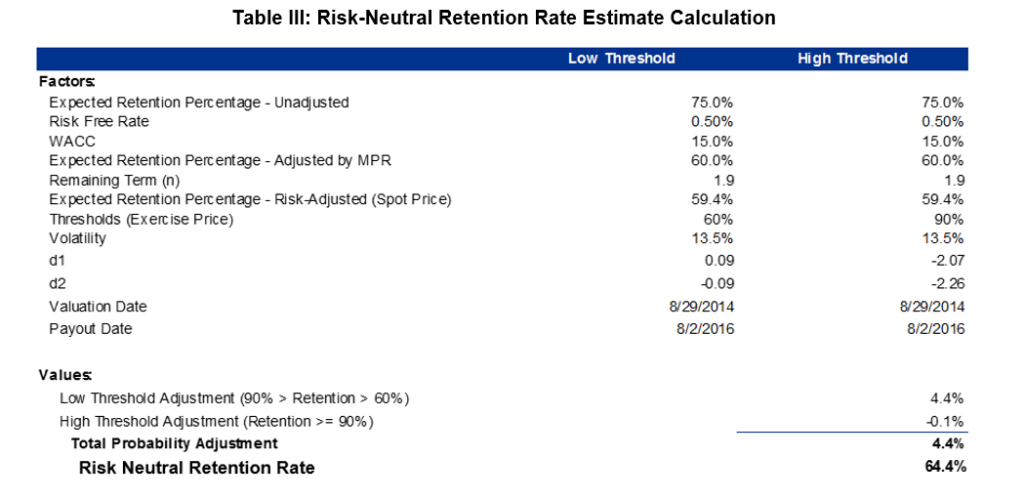
Applying this retention rate to the payment calculation results in the following estimated payment amount:

Management had not only provided a 75% estimated Retention Rate, but additionally, gave us their thoughts on the probability of the actual retention rate falling in one of a number of bands.
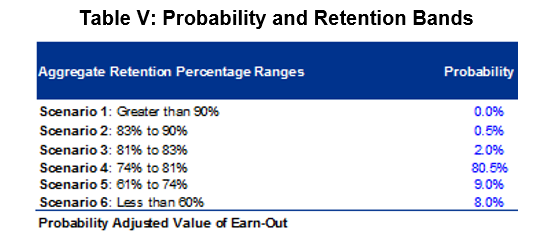
This supports the initial 75% Management retention estimate, but now the appraiser can calculate a resulting payout on a risk-adjusted basis. We will discount the weighted average result by the risk of non-payment. In our case the entity in question is not very risky and only a small repayment risk exists. Applying this risk to the output results in a value of the same earn-out of ~$24mn! The full calculation is described by the table below:
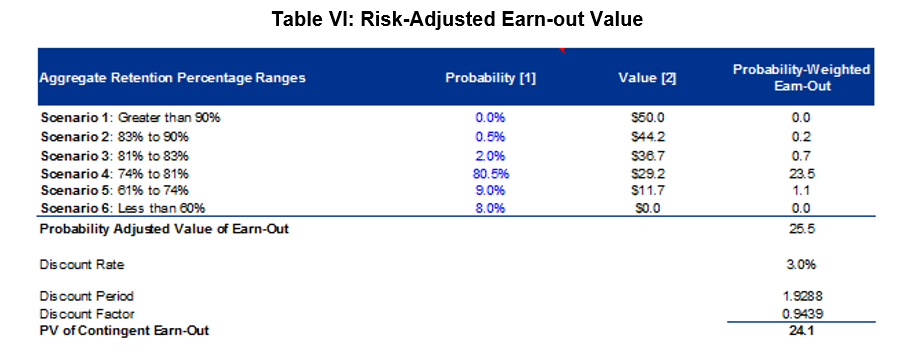
On the surface the above calculation would appear to be reasonable. The calculation includes a Management estimate, the probability distribution of achieving a certain retention rate and the credit risk of the payer. What is missing is the risk implied by the non-linear payout structure and levered nature of the payout. The revenue retention comes as a result of deploying capital with the risky expectation that customers will stay year-over-year. To quote The Appraisal Foundation Working Group 4’s first release on valuing contingent consideration entitled, “Valuation of Contingent Consideration”, “ [l]everage is most commonly thought of as an equity holder’s leveraged exposure to the underlying business as a result of debt. Nevertheless, leverage can also be characterized as a payoff resulting from something that is risky less something that is risk free (or relatively close to risk free.)”
The higher the retention rate, the lower the leverage, the higher the risk and associated discount rate. The risk-neutral framework eliminates the need to quantify the implied risk form the sliding leverage scale as retention rates increase.
If we use the above table for the purposes of calibrating to our risk- neutral solution, then the following implied discount rate falls out of the risk-adjusted analysis:
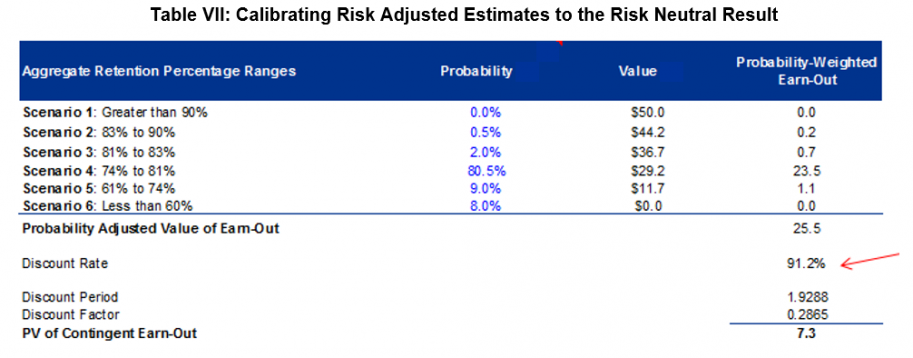
It is difficult to find naturally occurring 90%+ rates of return in the market. Supporting a rate this high outside of this calibration context is difficult if not impossible. Therefore, the risk-adjusted approach for a non-linear payout structure will result in challenges around identifying, supporting and defending the discount rate conclusion. The punchline is that in a non-linear payout structure, even with Management providing a decently constructed probability distribution, the answer with the least amount of required appraiser judgement is going to be generated by the OPM. However, one can always use the risk adjusted framework to validate the OPM result. We encourage the use of The Appraisal Foundation Working Group 4’s release and updated on valuing contingent consideration, and appreciate you taking the time to read this series.
Ask Our Experts


