

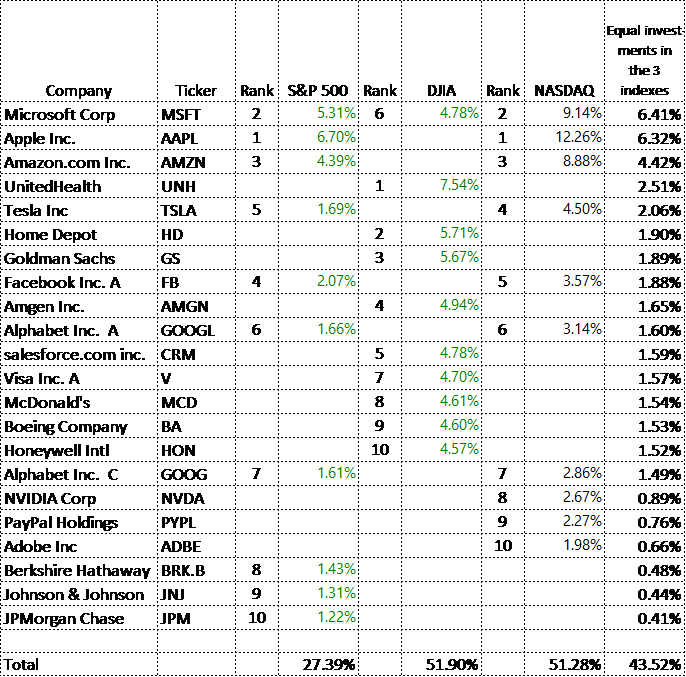
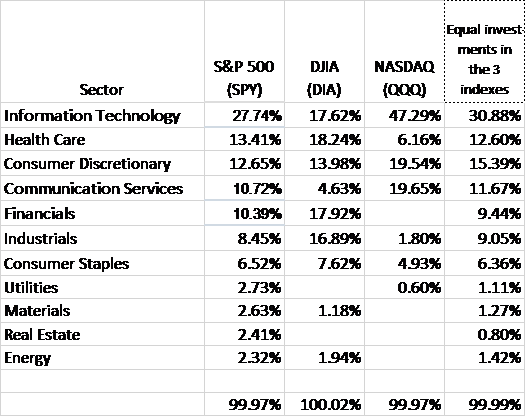
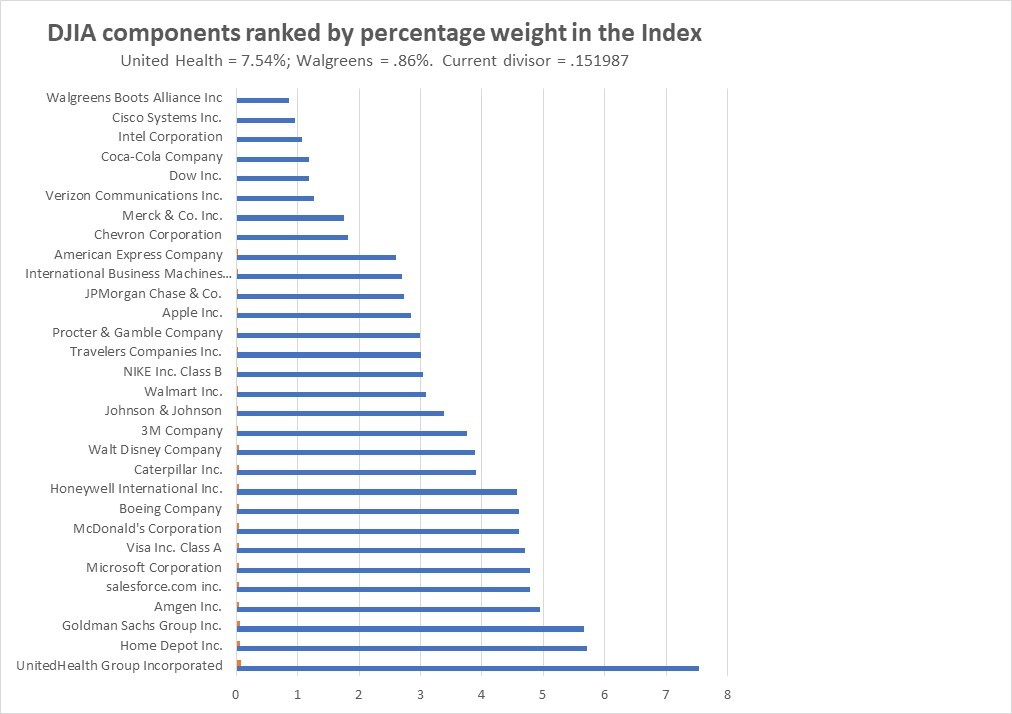
Here are additional charts with comparisons of the three major stock indexes where I show the top 10 components of each index and the percentage of each stock you will own if equal amounts are invested in funds comprised of each of those indexes, and of the sectors they comprise. Also is a chart showing the 30 components of the Dow Jones Industrial Average and the relative weights of each stock. All values are as of the close of business on December 31, 2020.
I will discuss these and last week’s charts and market performance in my next blog on Tuesday.
If you have any tax, business or financial issues you want to discuss please do not hesitate to contact me at [email protected].
Read More of the Partners’ Network Blog

