The American Hospital Association (“AHA”) released its annual report summarizing community benefits provided by tax-exempt hospitals, as reported on the Internal Revenue Service (“IRS”) Form 990, Schedule H. In its most recent report released in June 2022, AHA contracted with Candid (formerly Guidestar) to create a file of all electronically submitted Schedule H forms reported by tax-exempt hospitals in the 2019 tax year (“AHA 2019 Report”).
A total of 2,372 Schedule Hs were included in the AHA 2019 Report, representing 2,907 hospitals. Together, in 2019 these tax-exempt hospitals accounted for over $110 billion in total community benefits (as defined by the AHA), which represents an increase of $5 billion from the previous year. Approximately half of the $110 billion resulted from expenditures for financial assistance to patients; Medicaid shortfall and other unreimbursed costs from means-tested government programs with the exception of any Medicare shortfall.
Background
Tax-exempt hospitals file a Federal Form 990 annually, wherein they report their community benefit activities and associated costs on Schedule H, Part I. The Form 990 Schedule H, Part I incorporates the Catholic Health Association (“CHA”) general principles for community benefit rules and regulations.
IRS Form 990 Schedule H, Part I; Community Benefit
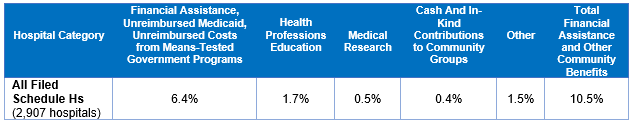
The AHA 2019 Report revealed that hospitals spent an average of 10.5% of total expenses attributable to community benefit under the IRS definition, commonly referred to as the “community benefit percentage”. This information is summarized on Schedule H, Part I, and includes the expense of providing financial assistance at cost, Medicaid shortfall, funding community health improvement services, underwriting health professions education, funding health research, subsidizing certain health services, and making cash/in-kind contributions for community benefit. Note that these expenses and resulting percentages are reported net of associated offsetting revenue and remuneration.
This information is further analyzed within the AHA 2019 Report by hospital size, location, and type.
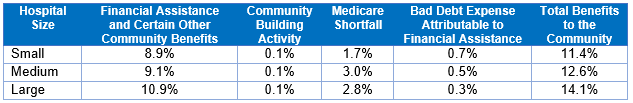
Size: Hospitals were then categorized by size, in terms of total hospital expenses, as follows:
- Small hospitals – less than $100 million
- Medium hospitals – $100 million to $299 million
- Large hospitals – $300 million and more
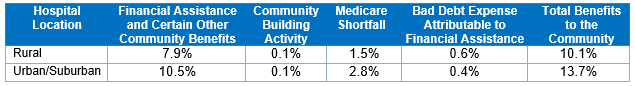
Location: Hospitals were categorized as “Urban/Suburban” or “Rural”.
Type: Hospitals were categorized by type as either a General Medical, Children’s, Teaching, or Critical Access hospitals. Note that a single hospital can be in more than one “type” category.
For all categories, the majority of community benefit expense is derived from providing financial assistance, Medicaid shortfall and the unreimbursed costs from other means-tested government programs (excluding Medicare shortfall).
Total Benefits to the Community
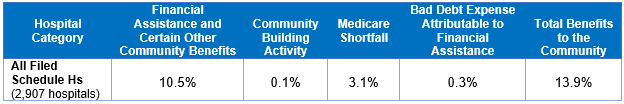
The AHA 2019 Report expands the IRS definition of community benefit and provides information with respect to “total benefits to the community”. Total benefits to the community include:
- Schedule H, Part I (financial assistance and certain other community benefits);
- Schedule H, Part II (community building activities); and
- Schedule H, Part III (Medicare shortfall and bad debt attributable to financial assistance).
For the 2019 tax year, tax-exempt hospitals on average incurred approximately 13.9% of their total annual expenses on “benefits to the community”, which is comprised of the following:
Size: The data shows a positive correlation between the hospital’s size and its average total community benefit expenses. For small hospitals approximately of 11.4% of their total expenses represented expenses spent on providing benefits to the community whereas medium hospitals and large hospitals incurred community expenses on providing benefits to the community of approximately 12.6% and 14.1%; respectively.
Location: Demographics typically have a substantial impact on a hospital’s community benefit and total benefits to the community. Data from the AHA 2019 Report indicated that total benefits provided to the community for Urban/Suburban hospitals was 3.6% higher than total benefits provided by Rural hospitals.
Please note that the data outlined above is based upon the Schedule Hs filed for 1,911 single hospitals and does not include group hospital Schedule H information, as the information attributable to individual hospitals within the group cannot be identified.
Type: The AHA 2019 Report indicated that Critical Access hospitals incurred an average of 10.7% of their total expenses on benefits to the community, whereas General Medical hospitals incurred an average of 13.5% in comparison. Teaching hospitals incurred an average of 13.7% and Children’s hospitals incurred an average of 14.8%.
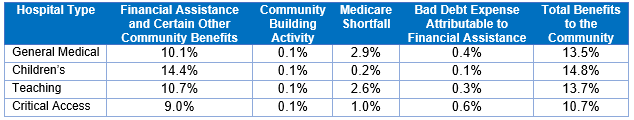
Children’s hospitals had a substantially higher percentage of community benefit expenses when compared to the other hospital types, which is typically attributable to a higher rate of unreimbursed Medicaid. In addition, the AHA 2019 Report indicated that Children’s hospitals spent an average of 1.8% of their total expenses on medical research, which was higher than any other hospital type. Please note that a single hospital can be in more than one “type” category outlined above.
Bad Debt Expense
The AHA 2019 Report revealed that 43% of the 2,907 individual hospitals reported bad debt expense attributable to the organization’s financial assistance policy. Most hospitals also reported that some portion of their bad debt expense would qualify as community benefit had the patient completed the hospitals’ financial assistance processes and provided the requisite financial and other information.
Medicare Surplus and Shortfall
Approximately 72% of the 2,907 hospitals reported having a Medicare shortfall on Part III, Section B of Schedule H. This shortfall, which accounted for an average of 3.1% of hospital expenses in 2019, occurs when the Federal government reimburses hospitals at less than their costs for treating Medicare patients.
Community Building Activities
Individual hospitals and systems reported an average of 0.1% of their total expenses on community building activities. These activities can include workforce development, environmental improvements, and hospital employee participation on state Boards of Health, regional health departments, neighborhood community relations committees, and with university and other school partnerships.
Scrutinizing Tax-Exempt Hospitals’ Community Benefit – The Lown Institute Report
In April 2022, the Lown Institute, released its Lown Institute Hospitals Index, a report which ranks community benefit spending for 275 nonprofit hospital systems nationwide against the estimated value of the hospitals’ tax exemption.
The Lown Institute report calculated each nonprofit hospital system’s “fair share” of spending on charity care and community investment activities as compared to the estimated value of the system’s tax exemption. The results showed that 227 of the 275 nonprofit hospital systems spent less on charity care and community investment than the estimated value of the system’s tax exemption.
Upon examining the methodology used behind the report, it is clear that the Lown Institute cherry-picks certain categories of community benefit while ignoring others. For example, the Lown Institute argues that Medicaid shortfall is not included in their calculations because hospitals also offer discounted rates to private insurers, which is not considered community benefit. However, the report fails to acknowledge that the Medicaid rates of reimbursement are already substantially lower as compared to private insurers. This idea is in direct conflict with the IRS community benefit standard as outlined in Rev. Rul. 69-545. Under Rev. Rul. 69-545, tax-exempt hospitals demonstrate community benefit by providing medical care for all patients able to pay, including those who pay their bills through public programs such as Medicaid and Medicare. As a result, tax-exempt hospitals relieve the government’s burden by absorbing underpayments from these means-tested government programs.
The Lown Institute establishes a threshold that hospitals that dedicated at least 5.9 percent of overall expenditures to charity care and meaningful community investment are considered to have spent their “fair share” against the purported value of their nonprofit tax exemption. However, it is worth noting that the data used to calculate this threshold is a decade old, and includes 2012 IRS Forms 990 data, 2012 CMS hospital cost reports, 2012 AHA Annual Survey data, a pre-TCJA corporate tax structure, and other dated information.
In addition, following Lown’s release both this year and last year, the AHA issued responses; this year’s response is entitled “Lown Institute Report on Hospital Community Benefits Misses Mark”.
Withum’s Healthcare Services Group agrees with AHA and also believes that the Lown Institute report does not capture the complete picture of a tax-exempt hospital’s community benefit, which is better reflected by referring to a hospital’s most recently filed Form 990, Schedule H.
Conclusion
AHA’s annual community benefit report is a useful resource available to all tax-exempt hospitals which can be utilized to benchmark and compare a hospital to national averages. While this report provides quick comparisons, it is important to note that each hospital has a different set of facts and circumstances to consider, including size, location, and hospital type, which can affect its community benefit percentage in relation to its peers.
Community benefit data, hospital operations/activities, and reporting transparency continue to be key areas of focus for all users of the Form 990. The IRS, Department of Health, state and local regulators, researchers, and the general public utilize Candid (formerly Guidestar) and other publicly available information to review tax-exempt hospitals’ total benefits to the community. Additionally, reports related to community benefit and the value of tax exemption continue to be released by the media and organizations, such as the Lown Institute.
It has become more important than ever that hospitals and healthcare systems regularly monitor and quantify their annual community benefit. In order to do so in the most effective and efficient way possible, Withum recommends the following:
- Consider forming a community benefit committee.
- Compare your most recent community health needs assessment (“CHNA”) in conjunction with Schedule H for new activities, programs and initiatives.
- Incorporate other recent Schedule H developments into your Schedule H including social determinants of health (“SDOH”); previously listed under community building activities which improve health and certain subsidized health programs.
- Benchmark your hospital(s) to its peers, both nationally and regionally, and by size.
- Calculate your net community benefit costs and percentage using methods other than CHA, including AHA and state reporting (where applicable) and disclose this information in Form 990 Schedule H or Schedule O.
- Consider a written community benefit statement to include with your annual Form 990.
- Review your Form 990 with your audit committee annually, including your Schedule H and applicable benchmarking information.
- Ensure key individuals of your organization are aware of your net community benefit costs and percentage and applicable benchmarking comparisons, including senior management and Board members.
Authors: Bill Hemmer, CPA | [email protected] and Tim White, MSA | [email protected]
Contact Us
For more information on this topic, please contact a member of Withum’s Healthcare Services Team.