

These charts continue an annual tradition I started ages ago to use when I assist clients with their financial plans. The charts show the 10-year annual and cumulative percentage gains or losses of the major stock market indexes, interest rates, currencies, and gold. The indexes include the dividends paid, the price to earnings ratio and this year I added the earnings percent and dividend payout ratio. Some of the amounts have been rounded or the calculations are rounded to facilitate review. These charts are provided for illustrative and educational purposes. No recommendations are made or should be inferred from the information presented. Also, note that past results are no indicator of future performance. I will discuss these results in succeeding blogs.
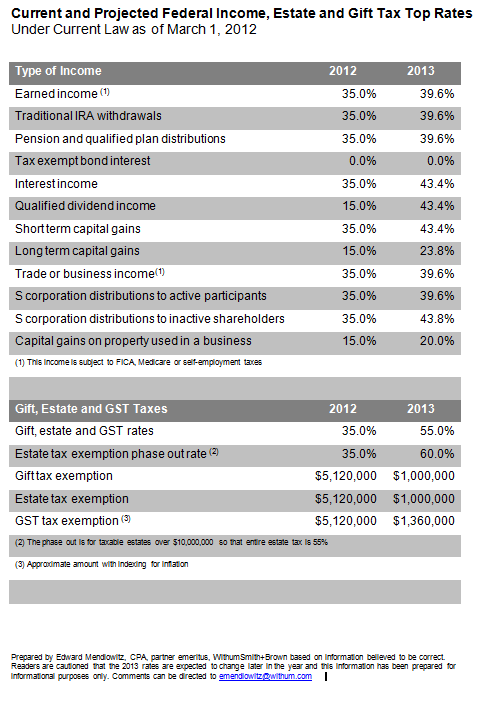
10 year financial benchmark performance of major stock market indexes,
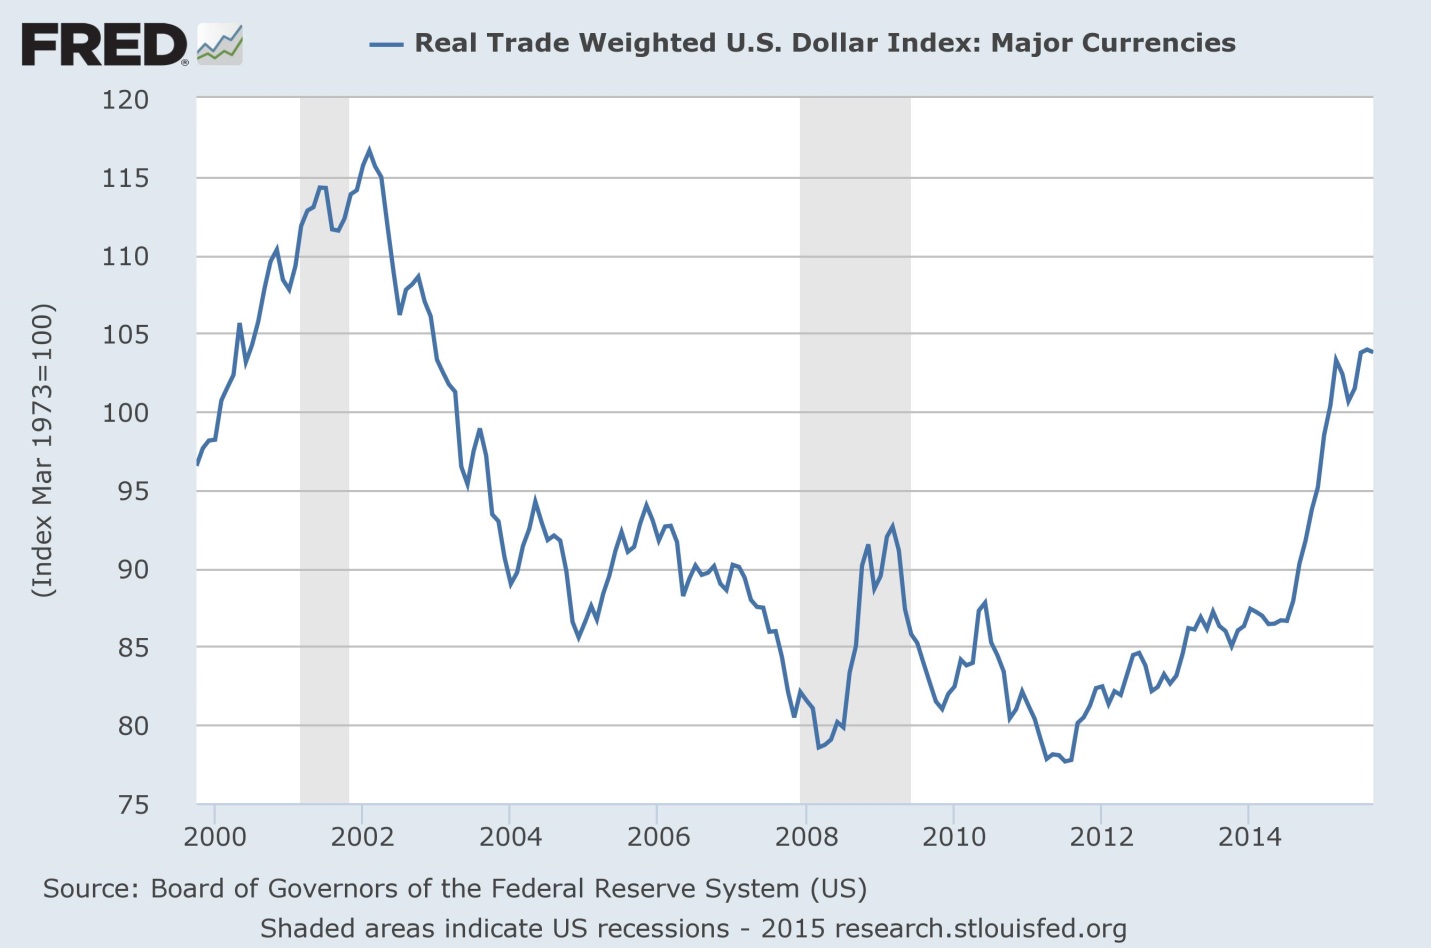
interest rates, currencies and gold
Do not hesitate to contact me with any business or financial questions at [email protected] or fill out the form below.
Read More of the Partners’ Network Blog
How Can We Help?

