
What’s In Your Wallet? Part II: Financial Indicators Impacting Resorts
As Part II of the financial indicators analysis, topics that will be covered below include balance sheet indicators, income statement indicators, and a final analysis to wrap up the What’s In Your Wallet series.
Balance Sheet Indicators
It is relevant to note again that not all resorts are created equal and a financial metric in one resort may signify a potential problem whereas it does not in another. Having the ability to understand the history of the financial information available and analyzing that data over a period of time is crucial. Some examples of items to look for were addressed in Part I. The case study below can assist in reading financial information contained in a resort’s financial statements and help determine a few of the significant items that can be measured.
The following is a sample balance sheet which can demonstrate some of the more common indicators that boards and management should be aware of:
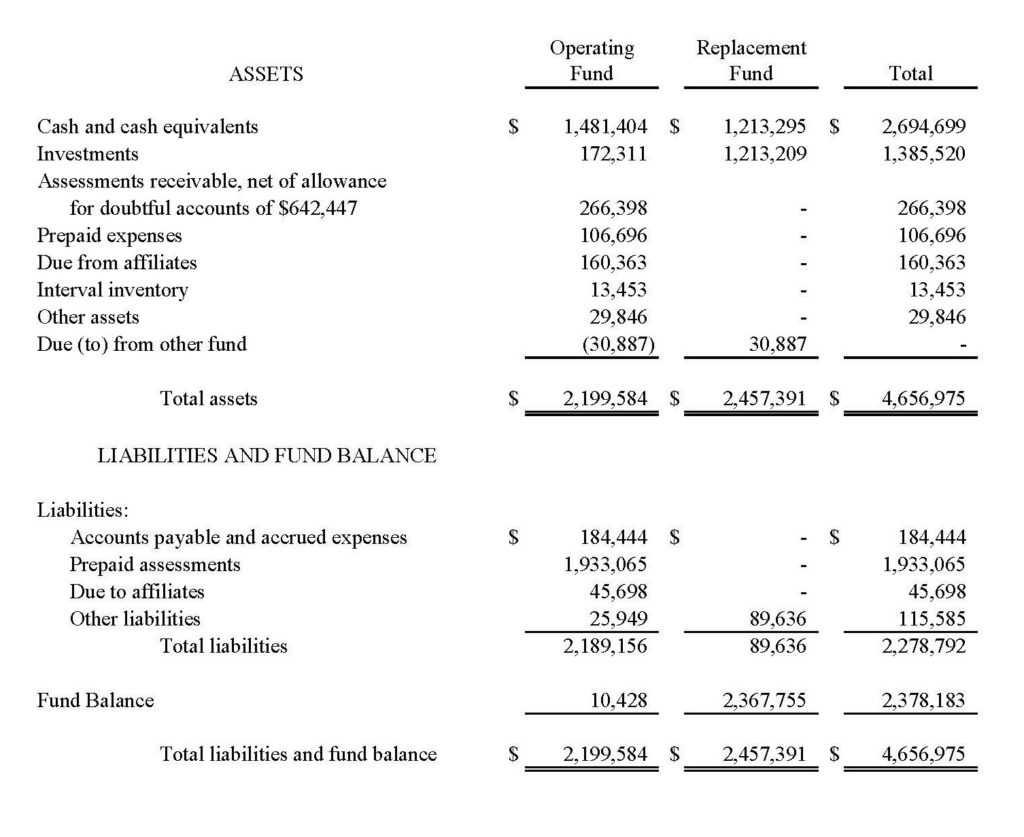
From an initial look, this appears to be a healthy resort with positive financial results, and it very well may be. There are a few items to note, however, in a deeper dive of the data.
The information shows that at the end of the year, the resort had collected approximately $1.93 million in assessments for the subsequent year (prepaid assessments). Cash and investments total approximately $1.65 million. These numbers appear to be strong, but when you compare them, they indicate that this resort has spent about $280,000 of next year’s money on this year’s expenses, representing approximately 14.5% of the funds collected. This could be an improvement over prior years which would suggest better budgeting, or it could be a higher usage percentage than in prior years, suggesting inadequate budgeting. Further, what is the percentage of assessments collected prior to year end to what was billed, and how does that comparison stack up with prior years? Are collections percentages stable or are there trends noted over the past few years that could be indicative of what’s to come?
In regard to replacement reserves, the financials show approximately $2.43 million in cash and investments. They also show a $31,000 receivable from the operating fund. Comparatively, this number is not large and appears imminently able to be satisfied. But could it be indicative of a future problem? It has already been seen that 14.5% of next year’s money was spent prior to year-end. Will the operating fund have the wherewithal to pay back the funds borrowed or was it potentially just a timing difference related to some expenditures made. This should be researched along with what the short-term capital replacement plans are, such as a need to replace the roof or upcoming unit refurbishments. The larger the amount (and corresponding percentage), the larger the potential problem.
Income Statement Indicators
The following is a sample statement of operations (income statement) and budget to actual comparison which can demonstrate some of the more common indicators that boards and management should be aware of in evaluating operation results:
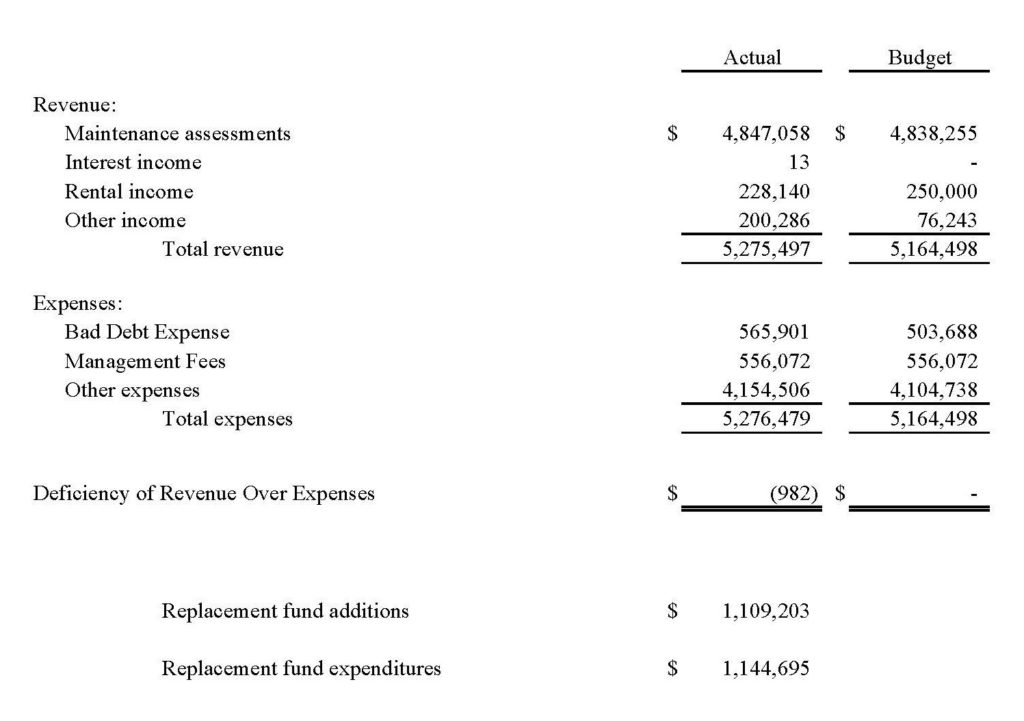
In keeping with the topic of replacement reserves, it is evident that spending outpaced assessments for the current year. The nature of the fund itself is designed for long term savings and periodic large expenses, so this situation is likely to happen periodically. The indicator comes in comparing this information to that of prior years. Has replacement fund spending exceeded assessments for a period of consecutive years? Are the large capital expenditures planned for the next couple of years going to allow for savings to be accumulated or are they planned to significantly or totally deplete the accumulated savings? Are replacement fund assessments adequate to continue to support a healthy plan for saving for future projects? These questions should be asked and answered before setting the replacement fund portion of assessments during the budget process. Aging resorts require increasingly more capital replacements and this fact should be considered when developing future estimates.
The statement above shows bad debt expense of approximately $566,000 and budgeted bad debt expense of approximately $504,000. This is a key indicator that seems to be pervasive in the industry. Actual bad debts for this year were 12.3% over budgeted amounts. This is a situation that needs to be closely monitored, as it can be indicative of unrealistic collections expectations, pressure to keep assessments low, or a lack of proper preparation and research before entering in to the budget process. The past several years of results should be reviewed to determine if this issue is isolated or if is ongoing. Regardless of the answer, it should be remedied and addressed with great seriousness.
It is also noted that the results of operations above showed a slight loss of approximately $1,000. This is pretty close to break even and most resorts are on a zero-based budget principal, so this amount does not appear worrisome at first blush. However, considering this in conjunction with the other items indicated may present some potential issues. If bad debts are over budget by 12.3%, what was under budget for the resort to come close to breaking even? In this case, other income was severely under budgeted which compensated for the under budgeted expenses. Careful research should be done to understand where the differences are so that better budgeting can be achieved in the future.
Final Analysis
So what are the key takeaways from the analysis performed?
- Good budgeting is the key to future success – don’t hold assessments steady in the face of cost of living increases just to be popular.
- Monitor resort collections closely and take timely action to minimize delinquencies.
- Project cash flow to determine if the resort will continue to need to use next year’s money to pay this year’s expenses and derive a multiyear plan to alleviate the problem.
- Waiving and underfunding replacement reserves are a short term cash flow solution which can have long term implications.
- Find methods to monetize inventory owned by the association and non-performing units to reduce the financial burden and strive to shift the inventory to new assessments-paying owners.
The financial analysis tips and tools provided here are by no means all-inclusive of the data that a resort has access to. An analysis of financial statement metrics should be done in conjunction with trended collection reports, detailed departmental budget to actual results, comparative data of similar resorts (where available) and other information specific to each resort that provides a relevant historical context. The steps can provide value in planning for a healthy financial future. Above all, a healthy, realistic budget with proper execution, monitoring and accountability is the key to success.
If you have additional questions or would like more information about the services our Hospitality group offers, please fill out the form below!
Reprinted with permission from Resort Trades, copyright 2017.
How Can We Help?